
MATLAB: An Introduction with Applications
6th Edition
ISBN: 9781119256830
Author: Amos Gilat
Publisher: John Wiley & Sons Inc
expand_more
expand_more
format_list_bulleted
Related questions
Question
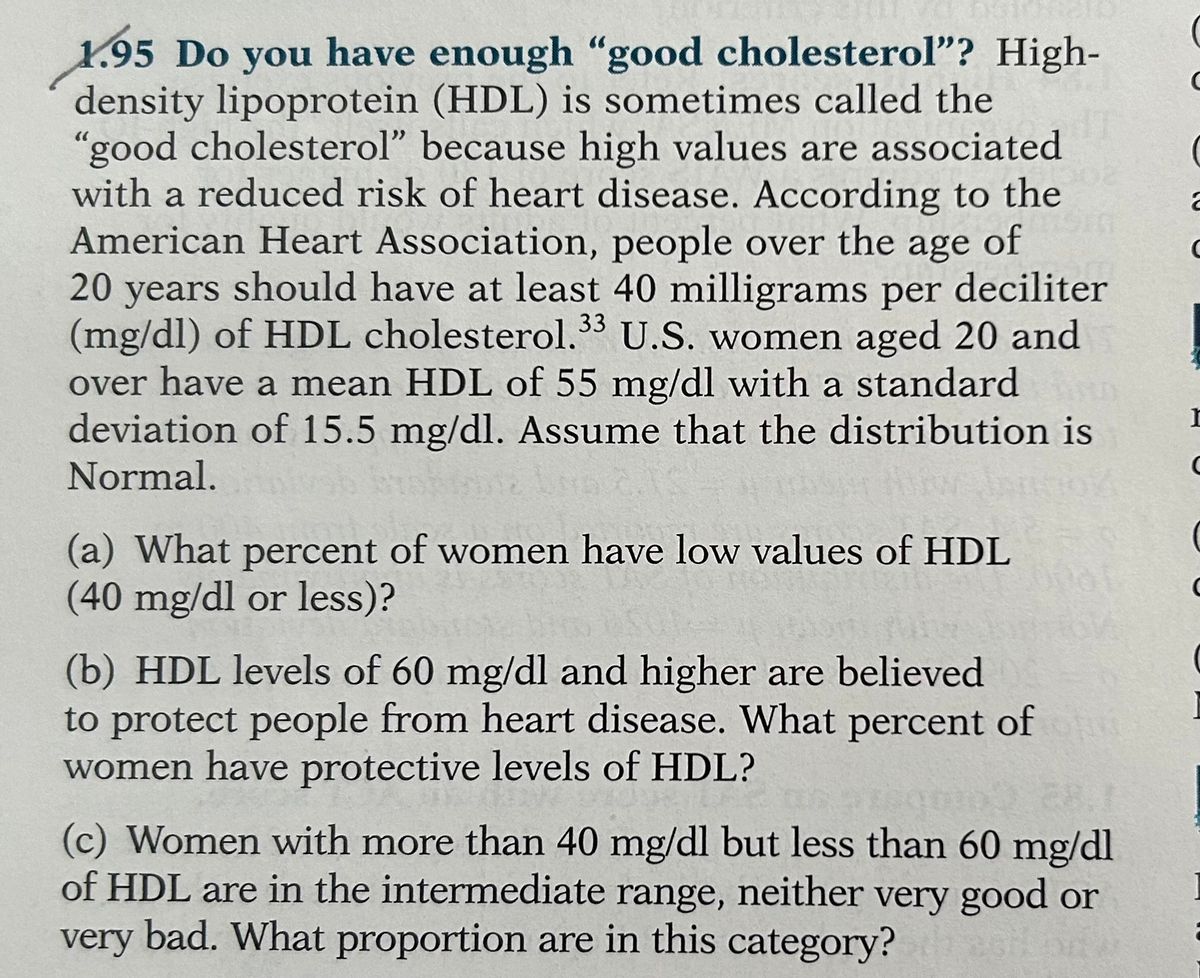

Transcribed Image Text:1.95 Do you have enough "good cholesterol"? High-
density lipoprotein (HDL) is sometimes called the
"good cholesterol" because high values are associated
with a reduced risk of heart disease. According to the
American Heart Association, people over the age of
20 years should have at least 40 milligrams per deciliter
(mg/dl) of HDL cholesterol.33 U.S. women aged 20 and
over have a mean HDL of 55 mg/dl with a standard
deviation of 15.5 mg/dl. Assume that the distribution is
Normal.
(a) What percent of women have low values of HDL
(40 mg/dl or less)?
(b) HDL levels of 60 mg/dl and higher are believed
to protect people from heart disease. What percent of
women have protective levels of HDL?
Clovere
2707
(c) Women with more than 40 mg/dl but less than 60 mg/dl
of HDL are in the intermediate range, neither very good or
very bad. What proportion are in this category?
C
2
I
с
Expert Solution
This question has been solved!
Explore an expertly crafted, step-by-step solution for a thorough understanding of key concepts.

This is a popular solution

Trending nowThis is a popular solution!

Step by stepSolved in 3 steps with 2 images

Knowledge Booster

Similar questions
- Please help it’s not gradedarrow_forwardI need help solving this problem in R. The size of the left upper chamber of the heart is one measure of cardiovascular health. When the upper left chamber is enlarged, the risk of heart problems is increased. The paper ("Left atrial size increases with body mass index in children")[https://www.ncbi.nlm.nih.gov/pubmed/19147240] (International Journal of Cardiology [2009]) described a study in which the left atrial size was measured for a large number of children age 5 to 15 years. Based on this data, the authors concluded that for healthy children, the left atrial diameter was approximately normally distributed with a mean of 26.4 mm and a standard deviation of 4.2 mm. i) Use `plotDist` to draw the probability density function of the left atrial diameter. ii) Generate 50 sample measurements of the left atrial diameters and plot the measurements using a histogram. iii) Approximately what proportion of healthy children have left atrial diameters less than 23.5 mm?arrow_forwardWhat is null and alternative hypothesis for this case? The U.S. Department of Health monitors fishing waters, to determine if the bacteria count has risen above a maximum safe level of 70.arrow_forward
- Overproduction of uric acid in the body can be an indication of cell breakdown. This may be an advance indication of illness such as gout, leukemia, or lymphoma.t Over a period of months, an adult male patient has taken seven blood tests for uric acid. The mean concentration was x = 5.29 mg/dl. The distribution of uric acid in healthy adult males can be assumed to be normal, with o = 1.95 mg/dl. (a) Find a 95% confidence interval for the population mean concentration of uric acid in this patient's blood. What is the margin of error? (Round your answers to two decimal places.) lower limit upper limit margin of error (b) What conditions are necessary for your calculations? (Select all that apply.) On is large O o is known O o is unknown O normal distribution of uric acid O uniform distribution of uric acid (c) Interpret your results in the context of this problem. O we are 95% confident that the true uric acid level for this patient falls within this interval. O we are 5% confident that…arrow_forwardA 2019 study surveyed Norwegian parents about their children's eating habits and taste sensitivities. We are interested in seeing if there is a relationship between sensitivity to sweetness and emotional overeating. The study reports an F* = 2.72 with df = 2 and dfw = 39. How many levels of 'sensitivity to sweetness' were used in the study? How many subjects participated in the entire study? Add Workarrow_forwardI have a dataset from 600 preschoolers with measures of grip strength for each individual. One individual subject had a z score of -1.5. Approximately how many preschoolers would have a grip strength lower than this individual. Show work please I don't understandarrow_forward
- Overproduction of uric acid in the body can be an indication of cell breakdown. This may be an advance indication of illness such as gout, leukemia, or lymphoma.t Over a period of months, an adult male patient has taken nine blood tests for uric acid. The mean concentration was x = 5.41 mg/dl. The distribution of uric acid in healthy adult males can be assumed to be normal, with o = 1.75 mg/dl. (a) Find a 95% confidence interval for the population mean concentration of uric acid in this patient's blood. What is the margin of error? (Round your answers to two decimal places.) lower limit upper limit margin of error (b) What conditions are necessary for your calculations? (Select all that apply.) normal distribution of uric acid On is large O o is unknown O uniform distribution of uric acid O o is known (c) Interpret your results in the context of this problem. The probability that this interval contains the true average uric acid level for this patient is 0.95. The probability that this…arrow_forwardfirst picture is the background informationarrow_forwardA taxi business owner is determining the type of tires for his cars for efficiency the fuel can be increased. Twelve cars were tested using type A tires and asked to travel on a certain route. The same car and driver, then do the same route and the same road conditions with type B tires. Fuel consumption (km/liter) is then recorded as (enclosed). Note: • Use the last digit of your ID (2602296545) in place of a value; • If the last digit is 0 then it is changed to 1; Example: ID 1234567890 → 1 Can we conclude that a car with type A tires has material consumption fuel better than a car with type B tires? Assumed population normally distributed and α=5%. a. Define a hypothesis statement for the case. b. Perform statistical test calculations. c. Give a conclusion from the results of these calculations.arrow_forward
arrow_back_ios
arrow_forward_ios
Recommended textbooks for you
- MATLAB: An Introduction with ApplicationsStatisticsISBN:9781119256830Author:Amos GilatPublisher:John Wiley & Sons Inc
 Probability and Statistics for Engineering and th...StatisticsISBN:9781305251809Author:Jay L. DevorePublisher:Cengage Learning
 Statistics for The Behavioral Sciences (MindTap C...StatisticsISBN:9781305504912Author:Frederick J Gravetter, Larry B. WallnauPublisher:Cengage Learning
  Elementary Statistics: Picturing the World (7th E...StatisticsISBN:9780134683416Author:Ron Larson, Betsy FarberPublisher:PEARSON
 The Basic Practice of StatisticsStatisticsISBN:9781319042578Author:David S. Moore, William I. Notz, Michael A. FlignerPublisher:W. H. Freeman
 Introduction to the Practice of StatisticsStatisticsISBN:9781319013387Author:David S. Moore, George P. McCabe, Bruce A. CraigPublisher:W. H. Freeman
MATLAB: An Introduction with Applications
Statistics
ISBN:9781119256830
Author:Amos Gilat
Publisher:John Wiley & Sons Inc
Probability and Statistics for Engineering and th...
Statistics
ISBN:9781305251809
Author:Jay L. Devore
Publisher:Cengage Learning
Statistics for The Behavioral Sciences (MindTap C...
Statistics
ISBN:9781305504912
Author:Frederick J Gravetter, Larry B. Wallnau
Publisher:Cengage Learning
Elementary Statistics: Picturing the World (7th E...
Statistics
ISBN:9780134683416
Author:Ron Larson, Betsy Farber
Publisher:PEARSON
The Basic Practice of Statistics
Statistics
ISBN:9781319042578
Author:David S. Moore, William I. Notz, Michael A. Fligner
Publisher:W. H. Freeman
Introduction to the Practice of Statistics
Statistics
ISBN:9781319013387
Author:David S. Moore, George P. McCabe, Bruce A. Craig
Publisher:W. H. Freeman