
ENGR.ECONOMIC ANALYSIS
14th Edition
ISBN: 9780190931919
Author: NEWNAN
Publisher: Oxford University Press
expand_more
expand_more
format_list_bulleted
Related questions
Question
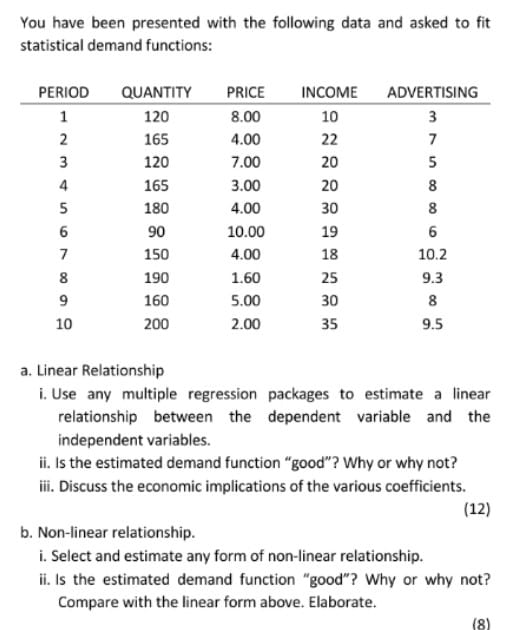

Transcribed Image Text:You have been presented with the following data and asked to fit
statistical demand functions:
PERIOD
QUANTITY
PRICE
INCOME
ADVERTISING
1
120
8.00
10
3
2
165
4.00
22
7
3
120
7.00
20
5
4
165
3.00
20
8
5
180
4.00
30
8.
90
10.00
19
7
150
4.00
18
10.2
8
190
1.60
25
9.3
9
160
5.00
30
8
10
200
2.00
35
9.5
a. Linear Relationship
i. Use any multiple regression packages to estimate a linear
relationship between the dependent variable and the
independent variables.
ii. Is the estimated demand function "good"? Why or why not?
i. Discuss the economic implications of the various coefficients.
(12)
b. Non-linear relationship.
i. Select and estimate any form of non-linear relationship.
ii. Is the estimated demand function "good"? Why or why not?
Compare with the linear form above. Elaborate.
(8)
Expert Solution
This question has been solved!
Explore an expertly crafted, step-by-step solution for a thorough understanding of key concepts.

This is a popular solution

Trending nowThis is a popular solution!

Step by stepSolved in 2 steps with 2 images

Knowledge Booster


Learn more about
Need a deep-dive on the concept behind this application? Look no further. Learn more about this topic, economics and related others by exploring similar questions and additional content below.Similar questions
- PRICE (Delars per tor 18 24 M 4 12 24 QUANTITY (Thousands of tons) Supply Demand O Total Revenue (Thousands of Dollars) Demand Supply Several growers are happy with this advancement in technology because now they can sell more crops, which they believe will lead to increases in revenue. Using elasticities, you will be able to determine whether this price change will lead to a rise or fall in total revenue in this market. Using the midpoint method, the price elasticity of demand for pistachios between the price levels of $15 and 59 per ton is 0.33, meaning that between these two points, demand is inelastic. Thus, you can conclude that the grower's claim is incorrect because total revenue will increase due to the technological improvement. Confirm your previous conclusion by calculating total revenue in the pistachio market before and after the technological improvement. Enter these values in the following table. Before Technological Improvement After Technological Improvementarrow_forwardOne of the growers is excited by the price increase caused by the blight because he believes it will increase revenue in this market. As an economics student, you can use elasticities to determine whether this change in price will lead to an increase or decrease in total revenue in this market. Using the midpoint method, the price elasticity of demand for soybeans between the prices of $10 and $12 per bushel is , which means demand is between these two points. Therefore, you would tell the grower that his claim is , because total revenue will as a result of the blight. Confirm your previous conclusion by calculating total revenue in the soybean market before and after the blight. Enter these values in the following table. Before Blight After Blight Total Revenue (Millions of Dollars)arrow_forwardCase 1: A local bakery has noticed a decrease in the demand for their pastries. They found out that a new bakery in town is offering similar pastries at a lower price. What should the local bakery do based on demand analysis? Case 2: A clothing store wants to estimate the demand for a new line of summer dresses. They have historical sales data for similar dresses. What method should they use for demand estimation? Case 3: A tech company is launching a new product. They want to forecast the demand for the product for the next year. They don't have historical sales data for similar products. What method should they use for demand forecasting? Case 4: A manufacturing company is trying to determine the cost of producing a new product. They know that the cost of raw materials and labor will increase with the number of units produced, but the cost of the machinery will remain the same regardless of the number of units produced. How should they categorize these costs in their cost analysis?…arrow_forward
- v Question Completion Status: 28 24 20 S2 16 S1 ND1 D2 01 0 4 4 8 12 16 20 24 Q 14. If this figure depicts the market for product X, and the demand for product X changed from D2 to D1 as a result of an increase in the price of a related product Y from $45 to $55, the cross price elasticity of demand for product X (calculated at Px = $18) is and the two products are O "1/6, substitutes" "6, substitutes" O "-6, complements "1/6, complements" QUESTION 15. Click Save and Submit to save and submit. Click Save All Answers to save all answers. Save All Answers 46 24 L AUG P 13 21 .... 284arrow_forwardNile.com, the online bookseller, wants to increase its total revenue. One strategy is to offer a 10% discount on every book it sells. Nile.com knows that its customers can be divided into two distinct groups according to their likely responses to the discount. The accompanying table shows how the two groups respond to the discount. Group A Group B(sales per week) (sales per week) Volume of sales beforethe 10% discount 1.55 million 1.50 million Volume of sales afterthe 10% discount 1.65 million 1.70 million A. Using the midpoint method, calculate the price elasticities of demand for group A and group B. B. Explain how the discount will affect total revenue from each group. C. Suppose Nile.com knows which group each customer belongs to when he or she logs on and can choose whether or not to offer the 10% discount. If Nile.com wants to increase its total revenue, should discounts be offered to group A or to group B, to neither group, or to both groups?arrow_forwardMike's Mechanic Shop increased its total monthly revenue from $6,500 to $7,200 when it reduced the price of an oil change from $65 to $50. The price elasticity of demand for Mike's Mechanic Shop is [NOTE: Total Revenue = Price x Quantity] Group of answer choices 1.38 0.72 0.39arrow_forward
- Quantity of A traded 10,000 15,000 Household Income | Price of B $3000 Price of A $1.10 $1.50 $0.90 $2500 $1.20 (i) Determine the price elasticity of demand for A, income elasticity of demand for A and the cross price elasticity of demand between A and B using the mid-point formula. Based on the elasticities, classify A in terms of its price and income elasticities of demand and establish the relationship between product A and product B. Given that the price of product A increases by 5%, household income increases by 3% and the price of product B increases by 2%, explain and compute the effect on the revenue from product A, assume each of the changes occurs separately. (ii) (b) The demand and supply functions of wheat is given as P = 20 – 0.05Q and P = 10 + 0.05Q, respectively. Solve for the equilibrium price and quantity in the wheat market. If the government implement a price floor of $18 per unit of wheat to help the wheat farmer, compute the consumer surplus, the producer surplus…arrow_forwardPage 2 3. In a study ("Price elasticity in the performing arts" by Kolhede, Gomez-Arias & Maximova 2023) researchers surveyed residents in one California county. They used responses to 28 questions about motivations to attend events to develop motivation factors and then clustered respondents into 3 segments based on their motivations. The authors estimated the performing arts event demand for each segment and calculated the demand elasticities at different prices and reported the following: Elasticities for the 3 segments with a $20 Admission Price were 0.317, 0.343, and 0.317 Elasticities for the 3 segments with a $60 Admission Price were 2.608, 3.269, and 2.590 Unitary Elasticity was at $41.50, $39.18, and $41.58 for the 3 segments Assume that the cost of event production is fixed (not related to attendance). As an economics expert, you are asked to help the performing arts group set ticket prices for next season. a. One committee of the performing arts group wanted to maximize…arrow_forwardWhen the price of movie tickets in a certain town was increased, the movie-theaters' revenues increased. This suggests that the demand for movie tickets in that town has a price-elasticity of demand that is: Group of answer choices 1. -1.4 2. 1.0 3. .45 4. 4.5arrow_forward
- Subpart 1-3arrow_forwardA firm is faced with the following demand function (estimated in a regression equation based onpast data).QX = 200 – 4PX , where current price (PX ) = $30The firm is thinking of reducing price to $25 because someone suggested that wouldbring in more revenue. a. What is the own-price elasticity of demand? (show absolute value)b. Is the demand function elastic, inelastic or unitary elastic at a price of $30?c. Will the price reduction bring in more revenue?arrow_forward
arrow_back_ios
arrow_forward_ios
Recommended textbooks for you
 Principles of Economics (12th Edition)EconomicsISBN:9780134078779Author:Karl E. Case, Ray C. Fair, Sharon E. OsterPublisher:PEARSON
 Engineering Economy (17th Edition)EconomicsISBN:9780134870069Author:William G. Sullivan, Elin M. Wicks, C. Patrick KoellingPublisher:PEARSON
 Principles of Economics (MindTap Course List)EconomicsISBN:9781305585126Author:N. Gregory MankiwPublisher:Cengage Learning
 Managerial Economics: A Problem Solving ApproachEconomicsISBN:9781337106665Author:Luke M. Froeb, Brian T. McCann, Michael R. Ward, Mike ShorPublisher:Cengage Learning
 Managerial Economics & Business Strategy (Mcgraw-...EconomicsISBN:9781259290619Author:Michael Baye, Jeff PrincePublisher:McGraw-Hill Education
Principles of Economics (12th Edition)
Economics
ISBN:9780134078779
Author:Karl E. Case, Ray C. Fair, Sharon E. Oster
Publisher:PEARSON
Engineering Economy (17th Edition)
Economics
ISBN:9780134870069
Author:William G. Sullivan, Elin M. Wicks, C. Patrick Koelling
Publisher:PEARSON
Principles of Economics (MindTap Course List)
Economics
ISBN:9781305585126
Author:N. Gregory Mankiw
Publisher:Cengage Learning
Managerial Economics: A Problem Solving Approach
Economics
ISBN:9781337106665
Author:Luke M. Froeb, Brian T. McCann, Michael R. Ward, Mike Shor
Publisher:Cengage Learning
Managerial Economics & Business Strategy (Mcgraw-...
Economics
ISBN:9781259290619
Author:Michael Baye, Jeff Prince
Publisher:McGraw-Hill Education