ENGR.ECONOMIC ANALYSIS
14th Edition
ISBN: 9780190931919
Author: NEWNAN
Publisher: Oxford University Press
expand_more
expand_more
format_list_bulleted
Question
I'm waiting for the answer desperately
It's in environmental economic textbook, kolstad.

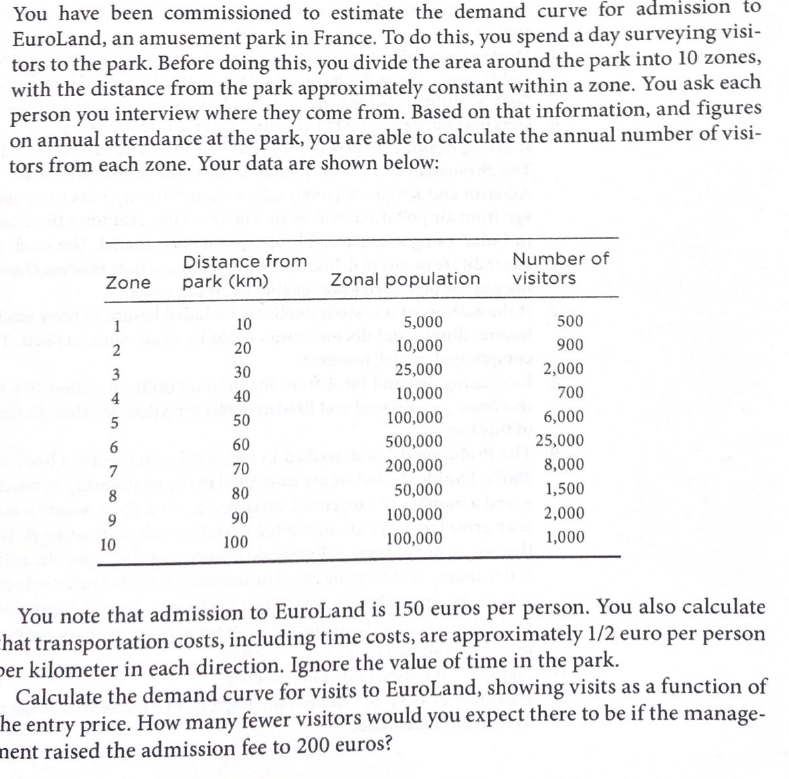
Transcribed Image Text:You have been commissioned to estimate the demand curve for admission to
EuroLand, an amusement park in France. To do this, you spend a day surveying visi-
tors to the park. Before doing this, you divide the area around the park into 10 zones
with the distance from the park approximately constant within a zone. You ask each
person you interview where they come from. Based on that information, and figures
on annual attendance at the park, you are able to calculate the annual number of visi-
tors from each zone. Your data are shown below:
Number of
visitors
Distance from
Zonal population
park (km)
Zone
500
5,000
10
1
10,000
900
20
2
2,000
25,000
30
3
700
10,000
40
4
6,000
100,000
50
25,000
500,000
60
6
8,000
200,000
70
7
50,000
1,500
80
8
2,000
100,000
90
9
1,000
100,000
100
10
You note that admission to EuroLand is 150 euros per person. You also calculate
hat transportation costs, including time costs, are approximately 1/2 euro per person
ber kilometer in each direction. Ignore the value of time in the park
Calculate the demand curve for visits to EuroLand, showing visits as a function of
he entry price. How many fewer visitors would you expect there to be if the manage-
nent raised the admission fee to 200 euros?
Expert Solution
This question has been solved!
Explore an expertly crafted, step-by-step solution for a thorough understanding of key concepts.
This is a popular solution
Trending nowThis is a popular solution!
Step by stepSolved in 7 steps with 5 images

Knowledge Booster
Learn more about
Need a deep-dive on the concept behind this application? Look no further. Learn more about this topic, economics and related others by exploring similar questions and additional content below.Similar questions
- Should the government legislate strict regulations for the gig-economy Give an assessment of the likely costs and benefits of your recommendation. Who will benefit and how? Who will be disadvantaged? What will be the effects on the community in general?arrow_forwardFish in the deep sea are being fished to the point of extinction, yet fish in privately owned fish farms are not. Think like an economist: What explains the difference? choosefrom answers below Group of answer choices a. Deep-sea fishermen can’t afford to be as environmentally conscious as fish farmers. b. Deep-sea fishermen tend to be “present oriented” while fish farmers tend to be “future oriented". c. Deep-sea fishermen do not bear the full costs of their harvesting decisions, while fish farmers do. d. None of the above.arrow_forwardWhat is the difference between private and social costs?arrow_forward
- Which of the following is an example of an activity that creates an external cost? i. a smoker emitting second-hand smoke ii. sulfur emitting from a smoke stack iii. throwing garbage on the roadside Oi only ii and iii iii only i and ii i, ii, and iiiarrow_forwardSpillovers or externalities: a. have been legislated out of existence. b. relate to both costs and benefits. c. None of the Above d. relate to benefits only. e. relate to costs only.arrow_forwardWhat issues impact the environmental economics in the developing world and in industrialized countries? Please give specific examples.arrow_forward
- In environmental economics: Suppose that society wants to reduce the quantity of discharged residuals into the natural environment, what are 3 ways to do so? What are some obstacles that could be associated with each one?arrow_forwardhow does implication of standards within environmental economics look like on a graph?arrow_forwardIf individual consumers have some obligation to support environmentally friendly technologies, should all consumers bear this responsibility equally? Or just those with the economic means to do so? How should society decide?arrow_forward
arrow_back_ios
arrow_forward_ios
Recommended textbooks for you

 Principles of Economics (12th Edition)EconomicsISBN:9780134078779Author:Karl E. Case, Ray C. Fair, Sharon E. OsterPublisher:PEARSON
 Engineering Economy (17th Edition)EconomicsISBN:9780134870069Author:William G. Sullivan, Elin M. Wicks, C. Patrick KoellingPublisher:PEARSON
 Principles of Economics (MindTap Course List)EconomicsISBN:9781305585126Author:N. Gregory MankiwPublisher:Cengage Learning
 Managerial Economics: A Problem Solving ApproachEconomicsISBN:9781337106665Author:Luke M. Froeb, Brian T. McCann, Michael R. Ward, Mike ShorPublisher:Cengage Learning
 Managerial Economics & Business Strategy (Mcgraw-...EconomicsISBN:9781259290619Author:Michael Baye, Jeff PrincePublisher:McGraw-Hill Education


Principles of Economics (12th Edition)
Economics
ISBN:9780134078779
Author:Karl E. Case, Ray C. Fair, Sharon E. Oster
Publisher:PEARSON

Engineering Economy (17th Edition)
Economics
ISBN:9780134870069
Author:William G. Sullivan, Elin M. Wicks, C. Patrick Koelling
Publisher:PEARSON

Principles of Economics (MindTap Course List)
Economics
ISBN:9781305585126
Author:N. Gregory Mankiw
Publisher:Cengage Learning

Managerial Economics: A Problem Solving Approach
Economics
ISBN:9781337106665
Author:Luke M. Froeb, Brian T. McCann, Michael R. Ward, Mike Shor
Publisher:Cengage Learning

Managerial Economics & Business Strategy (Mcgraw-...
Economics
ISBN:9781259290619
Author:Michael Baye, Jeff Prince
Publisher:McGraw-Hill Education