
MATLAB: An Introduction with Applications
6th Edition
ISBN: 9781119256830
Author: Amos Gilat
Publisher: John Wiley & Sons Inc
expand_more
expand_more
format_list_bulleted
Related questions
Question

Transcribed Image Text:### Problem Statement
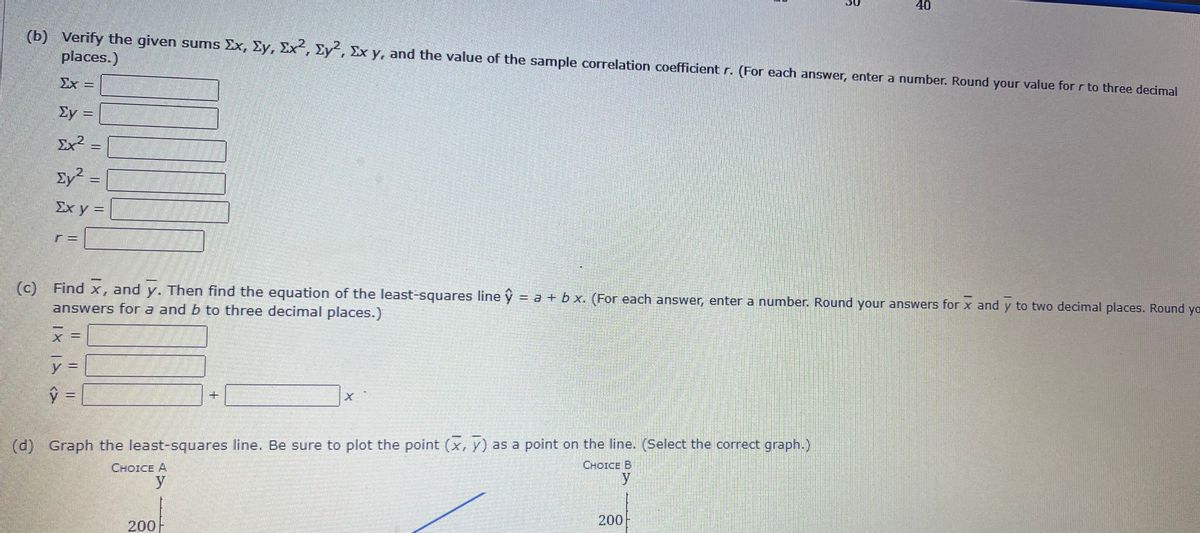
**(b)** Verify the given sums \(\sum x\), \(\sum y\), \(\sum x^2\), \(\sum y^2\), \(\sum xy\), and the value of the sample correlation coefficient \(r\). (For each answer, enter a number. Round your value for \(r\) to three decimal places.)
- \(\sum x =\) \_\_\_\_\_
- \(\sum y =\) \_\_\_\_\_
- \(\sum x^2 =\) \_\_\_\_\_
- \(\sum y^2 =\) \_\_\_\_\_
- \(\sum xy =\) \_\_\_\_\_
- \(r =\) \_\_\_\_\_
**(c)** Find \(\bar{x}\) and \(\bar{y}\). Then find the equation of the least-squares line \(\hat{y} = a + bx\). (For each answer, enter a number. Round your answers for \(\bar{x}\) and \(\bar{y}\) to two decimal places. Round your answers for \(a\) and \(b\) to three decimal places.)
- \(\bar{x} =\) \_\_\_\_\_
- \(\bar{y} =\) \_\_\_\_\_
- \(\hat{y} =\) \_\_\_\_\_ + \_\_\_\_\_ \(x\)
**(d)** Graph the least-squares line. Be sure to plot the point \((\bar{x}, \bar{y})\) as a point on the line. (Select the correct graph.)
**Graphs Explanation:**
Two choices labeled "Choice A" and "Choice B" are provided:
- **Choice A:** A graph with axes labeled \(y\) ranging from 0 to 200. It potentially shows a line which seems to be a candidate for the least-squares line.
- **Choice B:** Another graph similarly labeled with axes, showing a different potential line for the least-squares method.
The correct graph should include the plotted point \((\bar{x}, \bar{y})\) on the line.

Transcribed Image Text:### Understanding Calf Weight and Age at Bar-S Cattle Ranch
You are the foreman of the Bar-S cattle ranch in Colorado. A neighboring ranch has calves for sale, and you are considering purchasing some to add to the Bar-S herd. A fundamental aspect you are investigating is the relationship between age and weight in these calves. Specifically, how much should a healthy calf weigh at different ages?
#### Data Overview
The age (\(x\)) and weight (\(y\)) data for the calves is as follows:
| Age (weeks) \(x\) | Weight (kg) \(y\) |
|-------------------|-------------------|
| 1 | 39 |
| 5 | 47 |
| 11 | 73 |
| 16 | 100 |
| 26 | 150 |
| 36 | 200 |
#### Statistical Summary
- Sum of ages: \(\sum x = 95\)
- Sum of weights: \(\sum y = 609\)
- Sum of ages squared: \(\sum x^2 = 2375\)
- Sum of weights squared: \(\sum y^2 = 81,559\)
- Sum of products of ages and weights: \(\sum x y = 13,777\)
- Correlation coefficient: \(r \approx 0.997\)
#### Graphical Representation
To visualize the relationship between age and weight, examine the scatter plot diagrams. Choose the correct graph from the options shown:
- **Choice A:** Displays a scatter plot with a cluttered data pattern.
- **Choice B:** Portrays a clear linear relationship with increasing age associated with increasing weight.
- **Choice C and D:** Demonstrate scattered data with less apparent trends.
The scatter plot in **Choice B** accurately represents the data: as the age of calves increases, their weight also increases in a roughly linear pattern. This positive correlation is confirmed by a correlation coefficient (\(r\)) very close to 1, indicating a strong linear relationship.
#### Conclusion
Understanding these data patterns helps in determining growth expectations for the calves, guiding the decision on which ones to purchase for optimal growth of the herd at Bar-S Ranch.
Expert Solution
This question has been solved!
Explore an expertly crafted, step-by-step solution for a thorough understanding of key concepts.

This is a popular solution

Trending nowThis is a popular solution!

Step by stepSolved in 4 steps with 3 images

Knowledge Booster

Similar questions
- C. 314 d. 348 4. Ginise bought two pieces of wood in lengths of 72 inches and 104 inches. She needs to cut the wood into pieces of equal length. What is the greatest possible length of the pieces? Please don't handwriting solutionarrow_forwardYou are the foreman of the Bar-S cattle ranch in Colorado. A neighboring ranch has calves for sale, and you are going to buy some calves to add to the Bar-S herd. How much should a healthy calf weigh? Let x be the age of the calf (in weeks), and let y be the weight of the calf (in kilograms). x 3 4 12 16 26 36 y 42 54 77 100 150 200 Complete parts (a) through (e), given Σx = 97, Σy = 623, Σx2 = 2397, Σy2 = 83,109, Σxy = 13,966, and r ≈ 0.997. A) Find x, and y. Then find the equation of the least-squares line = a + bx. (Round your answers for x and y to two decimal places. Round your answers for a and b to three decimal places.) x = y = = + x B) Find the value of the coefficient of determination r2. What percentage of the variation in y can be explained by the corresponding variation in x and the least-squares line? What percentage is unexplained? (Round your answer for r2 to three decimal places. Round your answers for the percentages to one decimal…arrow_forwardThx in advance!arrow_forward
- you are the foreman of the Bar-S cattle ranch in Colorado. A neighboring ranch has calves for sale, and you are going to buy some calves to add to the Bar-S herd. How much should a healthy calf weigh? Let x be the age of the calf (in weeks), and let y be the weight of the calf (in kilograms). x 3 4 9 16 26 36 y 43 46 79 100 150 200 Complete parts (a) through (e), given Σx = 94, Σy = 618, Σx2 = 2334, Σy2 = 82,706, Σxy = 13,724, and r ≈ 0.998. (a) Draw a scatter diagram displaying the data.(b) Verify the given sums Σx, Σy, Σx2, Σy2, Σxy, and the value of the sample correlation coefficient r. (Round your value for r to three decimal places.) Σx = Σy = Σx2 = Σy2 = Σxy = r = (c) Find x, and y. Then find the equation of the least-squares line = a + bx. (Round your answers for x and y to two decimal places. Round your answers for a and b to three decimal places.) X Y Y_____ + ______x (d) Graph the least-squares line. Be sure to plot the point (x, y) as…arrow_forwardYou are the foreman of the Bar-S cattle ranch in Colorado. A neighboring ranch has calves for sale, and you are going to buy some calves to add to the Bar-S herd. How much should a healthy calf weigh? Let x be the age of the calf (in weeks), and let y be the weight of the calf (in kilograms). x 3 3 12 16 26 36 y 42 50 71 100 150 200 Complete parts (a) through (e), given Σx = 96, Σy = 613, Σx2 = 2390, Σy2 = 81,805, Σxy = 13,828, and r ≈ 0.993. (a) Draw a scatter diagram displaying the data. Flash Player version 10 or higher is required for this question. You can get Flash Player free from Adobe's website. (b) Verify the given sums Σx, Σy, Σx2, Σy2, Σxy, and the value of the sample correlation coefficient r. (Round your value for r to three decimal places.) Σx = Σy = Σx2 = Σy2 = Σxy = r = (c) Find x, and y. Then find the equation of the least-squares line = a + bx. (Round your answers for x and y to two decimal places. Round your…arrow_forwardYou are the foreman of the Bar-S cattle ranch in Colorado. A neighboring ranch has calves for sale, and you are going to buy some calves to add to the Bar-S herd. How much should a healthy calf weigh? Let x be the age of the calf (in weeks), and let y be the weight of the calf (in kilograms). x 3 4 12 16 26 36 y 37 46 77 100 150 200 Complete parts (a) through (e), given Σx = 97, Σy = 610, Σx2 = 2397, Σy2 = 81,914, Σxy = 13,919, and r ≈ 0.999. (b) Verify the given sums Σx, Σy, Σx2, Σy2, Σxy, and the value of the sample correlation coefficient r. (Round your value for r to three decimal places.) Σx = ? Σy = ? Σx2 = ? Σy2 = ? Σxy = ? r = ? (c) Find x, and y. Then find the equation of the least-squares line = a + bx. (Round your answers for x and y to two decimal places. Round your answers for a and b to three decimal places.) x =? y =? y =?+?x (e) Find the value of the coefficient of determination r2. What percentage of the variation in y can be…arrow_forward
- You are the foreman of the Bar-S cattle ranch in Colorado. A neighboring ranch has calves for sale, and you are going to buy some calves to add to the Bar-S herd. How much should a healthy calf weigh? Let x be the age of the calf (in weeks), and let y be the weight of the calf (in kilograms). x 3 3 9 16 26 36 y 47 51 77 100 150 200 Complete parts (a) through (e), given Σx = 93, Σy = 625, Σx2 = 2327, Σy2 = 83,239, Σxy = 13,687, and r ≈ 0.998. Verify the given sums Σx, Σy, Σx2, Σy2, Σxy, and the value of the sample correlation coefficient r. (Round your value for r to three decimal places.) Find x, and y. Then find the equation of the least-squares line = a + bx. (Round your answers for x and y to two decimal places. Round your answers for a and b to three decimal places.) Find the value of the coefficient of determination r2. What percentage of the variation in y can be explained by the corresponding variation in x and the least-squares line? What percentage is unexplained?…arrow_forwardYou are the foreman of the Bar-S cattle ranch in Colorado. A neighboring ranch has calves for sale, and you are going to buy some calves to add to the Bar-S herd. How much should a healthy calf weigh? Let x be the age of the calf (in weeks), and let y be the weight of the calf (in kilograms).arrow_forward
arrow_back_ios
arrow_forward_ios
Recommended textbooks for you
- MATLAB: An Introduction with ApplicationsStatisticsISBN:9781119256830Author:Amos GilatPublisher:John Wiley & Sons Inc
 Probability and Statistics for Engineering and th...StatisticsISBN:9781305251809Author:Jay L. DevorePublisher:Cengage Learning
 Statistics for The Behavioral Sciences (MindTap C...StatisticsISBN:9781305504912Author:Frederick J Gravetter, Larry B. WallnauPublisher:Cengage Learning
  Elementary Statistics: Picturing the World (7th E...StatisticsISBN:9780134683416Author:Ron Larson, Betsy FarberPublisher:PEARSON
 The Basic Practice of StatisticsStatisticsISBN:9781319042578Author:David S. Moore, William I. Notz, Michael A. FlignerPublisher:W. H. Freeman
 Introduction to the Practice of StatisticsStatisticsISBN:9781319013387Author:David S. Moore, George P. McCabe, Bruce A. CraigPublisher:W. H. Freeman
MATLAB: An Introduction with Applications
Statistics
ISBN:9781119256830
Author:Amos Gilat
Publisher:John Wiley & Sons Inc
Probability and Statistics for Engineering and th...
Statistics
ISBN:9781305251809
Author:Jay L. Devore
Publisher:Cengage Learning
Statistics for The Behavioral Sciences (MindTap C...
Statistics
ISBN:9781305504912
Author:Frederick J Gravetter, Larry B. Wallnau
Publisher:Cengage Learning
Elementary Statistics: Picturing the World (7th E...
Statistics
ISBN:9780134683416
Author:Ron Larson, Betsy Farber
Publisher:PEARSON
The Basic Practice of Statistics
Statistics
ISBN:9781319042578
Author:David S. Moore, William I. Notz, Michael A. Fligner
Publisher:W. H. Freeman
Introduction to the Practice of Statistics
Statistics
ISBN:9781319013387
Author:David S. Moore, George P. McCabe, Bruce A. Craig
Publisher:W. H. Freeman