
MATLAB: An Introduction with Applications
6th Edition
ISBN: 9781119256830
Author: Amos Gilat
Publisher: John Wiley & Sons Inc
expand_more
expand_more
format_list_bulleted
Related questions
Question
Statistics Question 21
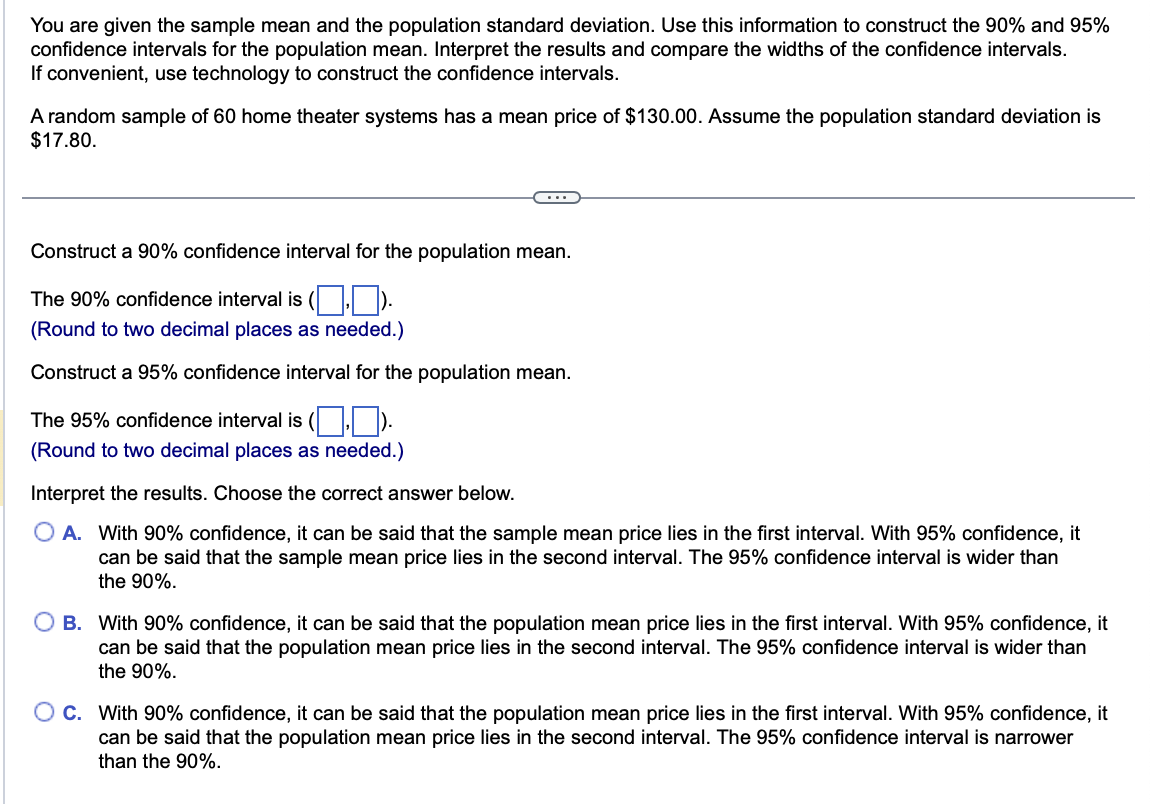

Transcribed Image Text:You are given the sample mean and the population standard deviation. Use this information to construct the 90% and 95%
confidence intervals for the population mean. Interpret the results and compare the widths of the confidence intervals.
If convenient, use technology to construct the confidence intervals.
A random sample of 60 home theater systems has a mean price of $130.00. Assume the population standard deviation is
$17.80.
Construct a 90% confidence interval for the population mean.
The 90% confidence interval is ().
(Round to two decimal places as needed.)
Construct a 95% confidence interval for the population mean.
The 95% confidence interval is ().
(Round to two decimal places as needed.)
Interpret the results. Choose the correct answer below.
O A. With 90% confidence, it can be said that the sample mean price lies in the first interval. With 95% confidence, it
can be said that the sample mean price lies in the second interval. The 95% confidence interval is wider than
the 90%.
B. With 90% confidence, it can be said that the population mean price lies in the first interval. With 95% confidence, it
can be said that the population mean price lies in the second interval. The 95% confidence interval is wider than
the 90%.
O C. With 90% confidence, it can be said that the population mean price lies in the first interval. With 95% confidence, it
can be said that the population mean price lies in the second interval. The 95% confidence interval is narrower
than the 90%.
Expert Solution
This question has been solved!
Explore an expertly crafted, step-by-step solution for a thorough understanding of key concepts.

This is a popular solution

Trending nowThis is a popular solution!

Step by stepSolved in 4 steps with 2 images

Knowledge Booster

Similar questions
- Prices and carats of 78 Prinicess cut loose diamonds from Brilliance.com. Prices ranged from $1,000 to $2,000. Carats ranged from 0.50 to 0.75. While I did not share, the diamonds are Color grades D, E, or F, and Clarity grades VVS1 and VVS2. Please show all work. Can carats explain prices? Provide evidence to support your answer. If the carats are 0.64, what is the expected price for the diamond? Price Carats 1005 0.53 1021 0.52 1044 0.50 1077 0.51 1086 0.50 1107 0.50 1115 0.51 1115 0.50 1274 0.50 1307 0.50 1508 0.52 1683 0.70 1757 0.60 1924 0.70 1987 0.72 1971 0.70 1955 0.75 1924 0.70 1854 0.66 1823 0.70 1823 0.54 1724 0.60 1724 0.60 1713 0.61 1669 0.71 1656 0.70 1656 0.70 1656 0.70 1648 0.60 1626 0.60 1589 0.50 1575 0.60 1568 0.64 1552 0.61 1533 0.53 1529 0.61 1522 0.61 1508 0.52 1463 0.56 1443 0.63 1088 0.75 1840 0.71 1934 0.70 1957 0.62 1570 0.74 1076 0.64 1983 0.66 1051…arrow_forwardMath Question Four How can I answer this fourth math question showed in the screenshot?arrow_forward(a) Suppose I have a bag with 4 marbles. One is red and 3 are green. Pick one marble, note the color and then put it back and pick a second marble. Find P(Both Red) = Explain your reasoning. P(Both Green) = %3D %3Darrow_forward
- Please do not give solution in image format thankuarrow_forwardQuestion Help ▼ The values listed below are waiting times (in minutes) of customers at two different banks. At Bank A, customers enter a single waiting line that feeds three teller windows. At Bank B, customers may enter an one of three different lines that have formed at three teller windows. Answer the following questions. 7.9 7.9 7.1 6.7 Bank A 6.3 6.6 6.7 6.8 7.2 7.4 7.9 Bank B 4.2 5.3 5.8 6.2 7.6 7.6 8.5 9.3 10.0 Click the icon to view the table of Chi-Square critical values. Construct a 95% confidence interval for the population standard deviation o at Bank A. min < Opank A min (Round to two decimal places as needed.) Construct a 95% confidence interval for the population standard deviation o at Bank B min < OBank B min (Round to two decimal places as needed.) Internret the results found in the previous parts Do the confidence intervals suagest a difference in the variation amona waitina times? Does the sinale-line svstem or the multinle-line svstem seem to be a Click to select…arrow_forwardiz Instructions Question 7 What is the value of X + 2 for the scores 1, 3, 2, 4? 08 10 O 12 14 < Previous Qarrow_forward
arrow_back_ios
arrow_forward_ios
Recommended textbooks for you
- MATLAB: An Introduction with ApplicationsStatisticsISBN:9781119256830Author:Amos GilatPublisher:John Wiley & Sons Inc
 Probability and Statistics for Engineering and th...StatisticsISBN:9781305251809Author:Jay L. DevorePublisher:Cengage Learning
 Statistics for The Behavioral Sciences (MindTap C...StatisticsISBN:9781305504912Author:Frederick J Gravetter, Larry B. WallnauPublisher:Cengage Learning
  Elementary Statistics: Picturing the World (7th E...StatisticsISBN:9780134683416Author:Ron Larson, Betsy FarberPublisher:PEARSON
 The Basic Practice of StatisticsStatisticsISBN:9781319042578Author:David S. Moore, William I. Notz, Michael A. FlignerPublisher:W. H. Freeman
 Introduction to the Practice of StatisticsStatisticsISBN:9781319013387Author:David S. Moore, George P. McCabe, Bruce A. CraigPublisher:W. H. Freeman
MATLAB: An Introduction with Applications
Statistics
ISBN:9781119256830
Author:Amos Gilat
Publisher:John Wiley & Sons Inc
Probability and Statistics for Engineering and th...
Statistics
ISBN:9781305251809
Author:Jay L. Devore
Publisher:Cengage Learning
Statistics for The Behavioral Sciences (MindTap C...
Statistics
ISBN:9781305504912
Author:Frederick J Gravetter, Larry B. Wallnau
Publisher:Cengage Learning
Elementary Statistics: Picturing the World (7th E...
Statistics
ISBN:9780134683416
Author:Ron Larson, Betsy Farber
Publisher:PEARSON
The Basic Practice of Statistics
Statistics
ISBN:9781319042578
Author:David S. Moore, William I. Notz, Michael A. Fligner
Publisher:W. H. Freeman
Introduction to the Practice of Statistics
Statistics
ISBN:9781319013387
Author:David S. Moore, George P. McCabe, Bruce A. Craig
Publisher:W. H. Freeman