
MATLAB: An Introduction with Applications
6th Edition
ISBN: 9781119256830
Author: Amos Gilat
Publisher: John Wiley & Sons Inc
expand_more
expand_more
format_list_bulleted
Related questions
Topic Video
Question
thumb_up100%
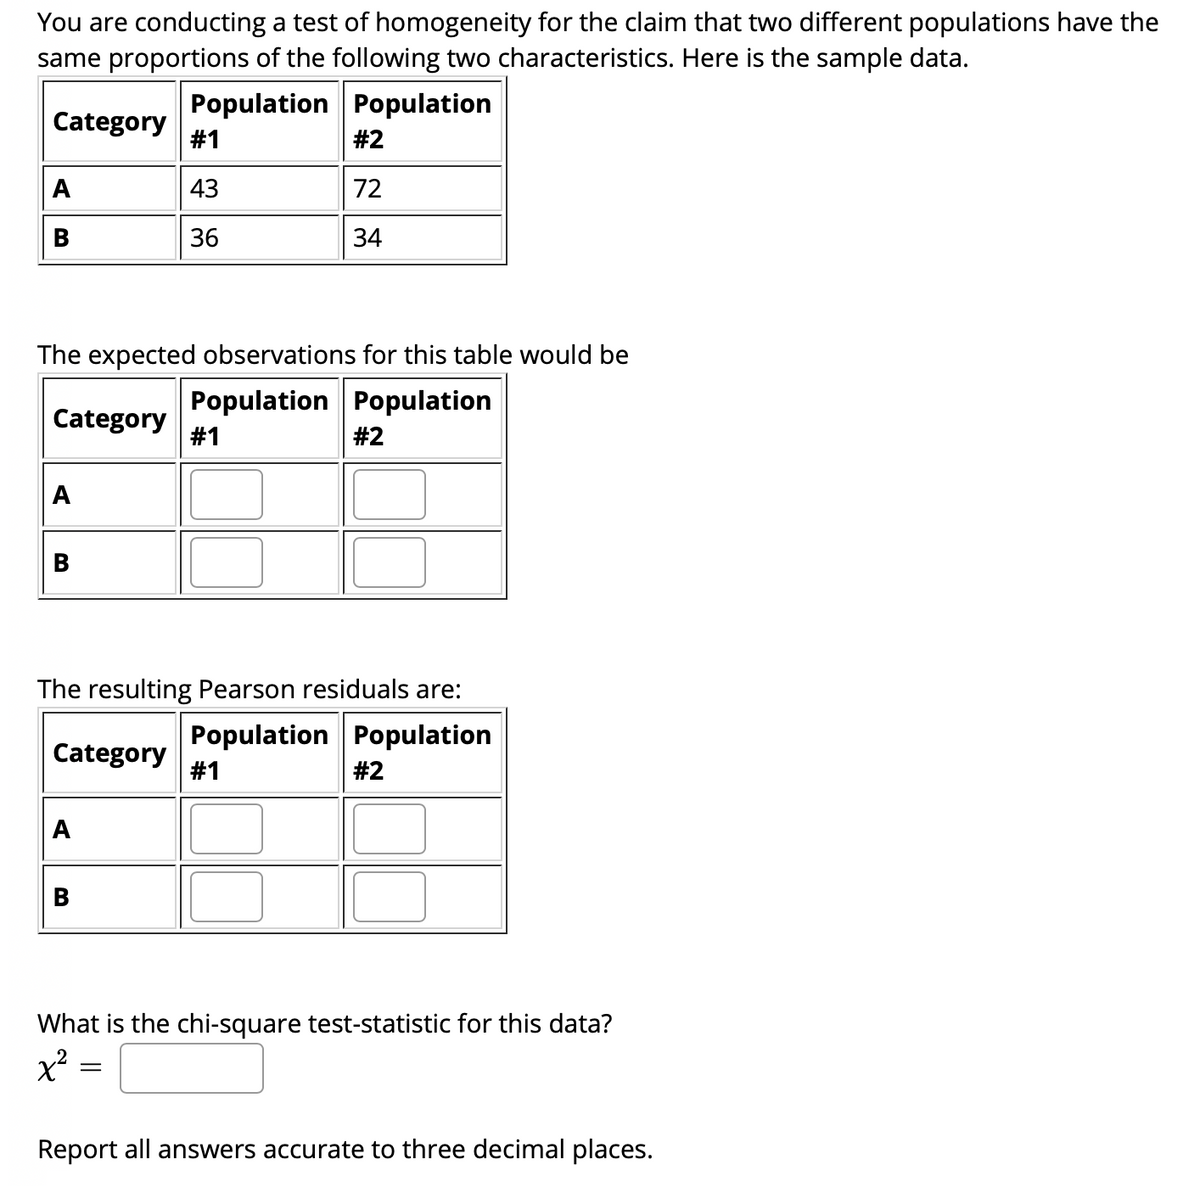

Transcribed Image Text:You are conducting a test of homogeneity for the claim that two different populations have the
same proportions of the following two characteristics. Here is the sample data.
Population Population
Category
#1
#2
A
43
72
В
36
34
The expected observations for this table would be
Population Population
Category
#1
#2
A
B
The resulting Pearson residuals are:
Population Population
Category
#1
#2
A
B
What is the chi-square test-statistic for this data?
x²
Report all answers accurate to three decimal places.
Expert Solution
This question has been solved!
Explore an expertly crafted, step-by-step solution for a thorough understanding of key concepts.

Step by stepSolved in 2 steps

Knowledge Booster


Learn more about
Need a deep-dive on the concept behind this application? Look no further. Learn more about this topic, statistics and related others by exploring similar questions and additional content below.Similar questions
- 7arrow_forwardYou wish to test the claim that the first population mean is not equal to the second population mean at a significance level of α=0.02 . Ho:μ1=μ2 Ha:μ1≠μ2 You obtain the following two samples of data. Sample #1 Sample #2 67.1 64.2 32.7 49.0 63.8 54.8 63.5 54.1 65.6 54.8 40.5 58.7 39.4 43.1 72.5 73.1 70.2 71.2 68.1 73.1 79.7 67.3 66.5 61.7 62.9 76.5 What is the test statistic for this sample?test statistic = Round to 3 decimal places. What is the p-value for this sample?p-value = Use Technology Round to 4 decimal places. The p-value is... less than (or equal to) α greater than α This test statistic leads to a decision to... reject the null accept the null fail to reject the null As such, the final conclusion is that... There is sufficient evidence to warrant rejection of the claim that the first population mean is not equal to the second population mean. There is not sufficient…arrow_forwardChoose the appropriate statistical test. When computing, be sure to round each answer as indicated. A dentist wonders if depression affects ratings of tooth pain. In the general population, using a scale of 1-10 with higher values indicating more pain, the average pain rating for patients with toothaches is 6.8. A sample of 30 patients that show high levels of depression have an average pain rating of 7.1 (variance 0.8). What should the dentist determine? 1. Calculate the estimated standard error. (round to 3 decimals). [st.error] 2. What is thet-obtained? (round to 3 decimals). 3. What is the t-cv? (exact value) 4. What is your conclusion? Only type "Reject" or Retain"arrow_forward
- Also included in question find estimated variance of errors, estimated variance of slope, and 90% and 95% confidence intervals for slope. Thank you so mucharrow_forwardIn this problem, we use your critical values table to explore the significance ofr based on different sample sizes. Critical Values for Correlation Coefficient r a = 0.05 =0.01 „A=0.05 a = 0.01 a = 0.05 a = 0.01 3. 1.00 1.00 13 0.53 0.68 23 0.41 0.53 4. 0.95 0.99 14 0.53 0.66 24 0.40 0.52 0.88 0.96 15 0.51 0.64 25 0.40 0.51 6. 0.81 0.92 16 0.50 0.61 26 0.39 0.50 0.75 0.87 17 0.48 0.61 27 0.38 0.49 8. 0.71 0.83 18 0.47 0.59 28 0.37 0.48 9. 0.67 0.80 19 0.46 0.58 29 0.37 0.47 10 0.63 0.76 20 0.44 0.56 30 0.36 0.46 11 0.60 0.73 21 0.43 0.55 12 0.58 0.71 22 0.42 0.54arrow_forwardYou are conducting a test of homogeneity for the claim that two different populations have the same proportions of the following two characteristics. Here is the sample data. Population Population Category #1 #2 A 40 102 28 84 The expected observations for this table would be Population Population Category #1 #2 A 38.02 103.98 29.98 82.02 The resulting Pearson residuals are: Population Population Category #1 #2 0.103 0.038 0.131 0.048 Chp -> Ce & 5 7. 00 16 %24 4arrow_forward
arrow_back_ios
arrow_forward_ios
Recommended textbooks for you
- MATLAB: An Introduction with ApplicationsStatisticsISBN:9781119256830Author:Amos GilatPublisher:John Wiley & Sons Inc
 Probability and Statistics for Engineering and th...StatisticsISBN:9781305251809Author:Jay L. DevorePublisher:Cengage Learning
 Statistics for The Behavioral Sciences (MindTap C...StatisticsISBN:9781305504912Author:Frederick J Gravetter, Larry B. WallnauPublisher:Cengage Learning
  Elementary Statistics: Picturing the World (7th E...StatisticsISBN:9780134683416Author:Ron Larson, Betsy FarberPublisher:PEARSON
 The Basic Practice of StatisticsStatisticsISBN:9781319042578Author:David S. Moore, William I. Notz, Michael A. FlignerPublisher:W. H. Freeman
 Introduction to the Practice of StatisticsStatisticsISBN:9781319013387Author:David S. Moore, George P. McCabe, Bruce A. CraigPublisher:W. H. Freeman
MATLAB: An Introduction with Applications
Statistics
ISBN:9781119256830
Author:Amos Gilat
Publisher:John Wiley & Sons Inc
Probability and Statistics for Engineering and th...
Statistics
ISBN:9781305251809
Author:Jay L. Devore
Publisher:Cengage Learning
Statistics for The Behavioral Sciences (MindTap C...
Statistics
ISBN:9781305504912
Author:Frederick J Gravetter, Larry B. Wallnau
Publisher:Cengage Learning
Elementary Statistics: Picturing the World (7th E...
Statistics
ISBN:9780134683416
Author:Ron Larson, Betsy Farber
Publisher:PEARSON
The Basic Practice of Statistics
Statistics
ISBN:9781319042578
Author:David S. Moore, William I. Notz, Michael A. Fligner
Publisher:W. H. Freeman
Introduction to the Practice of Statistics
Statistics
ISBN:9781319013387
Author:David S. Moore, George P. McCabe, Bruce A. Craig
Publisher:W. H. Freeman