MATLAB: An Introduction with Applications
6th Edition
ISBN: 9781119256830
Author: Amos Gilat
Publisher: John Wiley & Sons Inc
expand_more
expand_more
format_list_bulleted
Concept explainers
Topic Video
Question

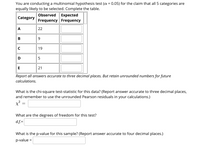
Transcribed Image Text:You are conducting a multinomial hypothesis test (a = 0.05) for the claim that all 5 categories are
equally likely to be selected. Complete the table.
Observed Expected
Frequency Frequency
Category
A
22
B
9.
19
D
5
E
21
Report all answers accurate to three decimal places. But retain unrounded numbers for future
calculations.
What is the chi-square test-statistic for this data? (Repo
and remember to use the unrounded Pearson residuals in your calculations.)
swer accurate to three decimal places,
What are the degrees of freedom for this test?
d.f.=
What is the p-value for this sample? (Report answer accurate to four decimal places.)
p-value =
Expert Solution
This question has been solved!
Explore an expertly crafted, step-by-step solution for a thorough understanding of key concepts.
This is a popular solution
Trending nowThis is a popular solution!
Step by stepSolved in 3 steps with 3 images

Knowledge Booster
Learn more about
Need a deep-dive on the concept behind this application? Look no further. Learn more about this topic, statistics and related others by exploring similar questions and additional content below.Similar questions
- A quiz related to digital knowledge was conducted. The quiz had 10 questions and covered topics such as the purpose of browser cookies, phishing scams, and privacy policies. The survey was given to 50 people. The mean score is 4.1 with a standard deviation of 2.6. We want to know if the data provide evidence that the mean score in the population is lower than 5. We will use alpha = 0.05 to make our decision. part a. Is this a one-sided or two-sided test? part b. What is the standard error for this problem? part c. How many degrees of freedom do we have for this problem? part d. What is the test statistic, t, for this problem? Based on your test statistic and degrees of freedom, the p-value will be between what two values? (If you cannot find the exact df in the table, round down to be safe. So if you have 38 df, round down to 30df.) Group of answer choices The p-value is between .1 and .05 The p-value is between .05 and .025 The p-value is between .025 and .01 The p-value…arrow_forwardA random sample of Californians has a mean age of 34.4, but you want to know the mean age of all Californians. It sounds like you want to generalize from a ________ to a _________, and therefore you need to worry about ________. a. population; sample; descriptive statistics b. statistic; parameter; sampling error c. central tendency measure; variability measure; random selection d. sample; population; operational definitionsarrow_forwardPlease answer the second question. Thank you.arrow_forward
- Consider the following data: −10, −10, 0, 3, −10, 3, 3 Step 1 of 3: Calculate the value of the sample Variance. Round your answer to one decimal place. Step 2 of 3: Calculate the value of the sample deviation. Round your answer to one decimal place. Step 3 of 3: Calculate the value of the range.arrow_forward#3arrow_forwardComplete the table. Observed Expected Frequency Frequency Residual Squared Category A 25 21 36 20 What is the chi-square test-statistic for this data? Barrow_forward
- N You are interested in determining if the pandemic has caused people to become depressed. You randomly sample 20 individuals and administer a 30 item true/false psychological test designed to measure depression. Scores that are greater than 20 indicate significant levels of depression. Use the following descriptive statistics to determine if individuals in your sample are depressed. Mean Std. Deviation Score 8 22.25 2.49 0.025 Use these data to answer the following questions. Chapter 9 is most relevant here. Two-tailed test critical regionarrow_forwardI need help with these please thank youarrow_forwardClaim: Most adults would erase all of their personal information online if they could. A software firm survey of 475 randomly selected adults showed that 65% of them would erase all of their personal information online if they could. Find the value of the test statistic. The value of the test statistic is (Round to two decimal places as needed.)arrow_forward
arrow_back_ios
arrow_forward_ios
Recommended textbooks for you
 MATLAB: An Introduction with ApplicationsStatisticsISBN:9781119256830Author:Amos GilatPublisher:John Wiley & Sons Inc
 Probability and Statistics for Engineering and th...StatisticsISBN:9781305251809Author:Jay L. DevorePublisher:Cengage Learning
 Statistics for The Behavioral Sciences (MindTap C...StatisticsISBN:9781305504912Author:Frederick J Gravetter, Larry B. WallnauPublisher:Cengage Learning
 Elementary Statistics: Picturing the World (7th E...StatisticsISBN:9780134683416Author:Ron Larson, Betsy FarberPublisher:PEARSON
 The Basic Practice of StatisticsStatisticsISBN:9781319042578Author:David S. Moore, William I. Notz, Michael A. FlignerPublisher:W. H. Freeman
 Introduction to the Practice of StatisticsStatisticsISBN:9781319013387Author:David S. Moore, George P. McCabe, Bruce A. CraigPublisher:W. H. Freeman

MATLAB: An Introduction with Applications
Statistics
ISBN:9781119256830
Author:Amos Gilat
Publisher:John Wiley & Sons Inc

Probability and Statistics for Engineering and th...
Statistics
ISBN:9781305251809
Author:Jay L. Devore
Publisher:Cengage Learning

Statistics for The Behavioral Sciences (MindTap C...
Statistics
ISBN:9781305504912
Author:Frederick J Gravetter, Larry B. Wallnau
Publisher:Cengage Learning

Elementary Statistics: Picturing the World (7th E...
Statistics
ISBN:9780134683416
Author:Ron Larson, Betsy Farber
Publisher:PEARSON

The Basic Practice of Statistics
Statistics
ISBN:9781319042578
Author:David S. Moore, William I. Notz, Michael A. Fligner
Publisher:W. H. Freeman

Introduction to the Practice of Statistics
Statistics
ISBN:9781319013387
Author:David S. Moore, George P. McCabe, Bruce A. Craig
Publisher:W. H. Freeman