
A First Course in Probability (10th Edition)
10th Edition
ISBN: 9780134753119
Author: Sheldon Ross
Publisher: PEARSON
expand_more
expand_more
format_list_bulleted
Related questions
Question
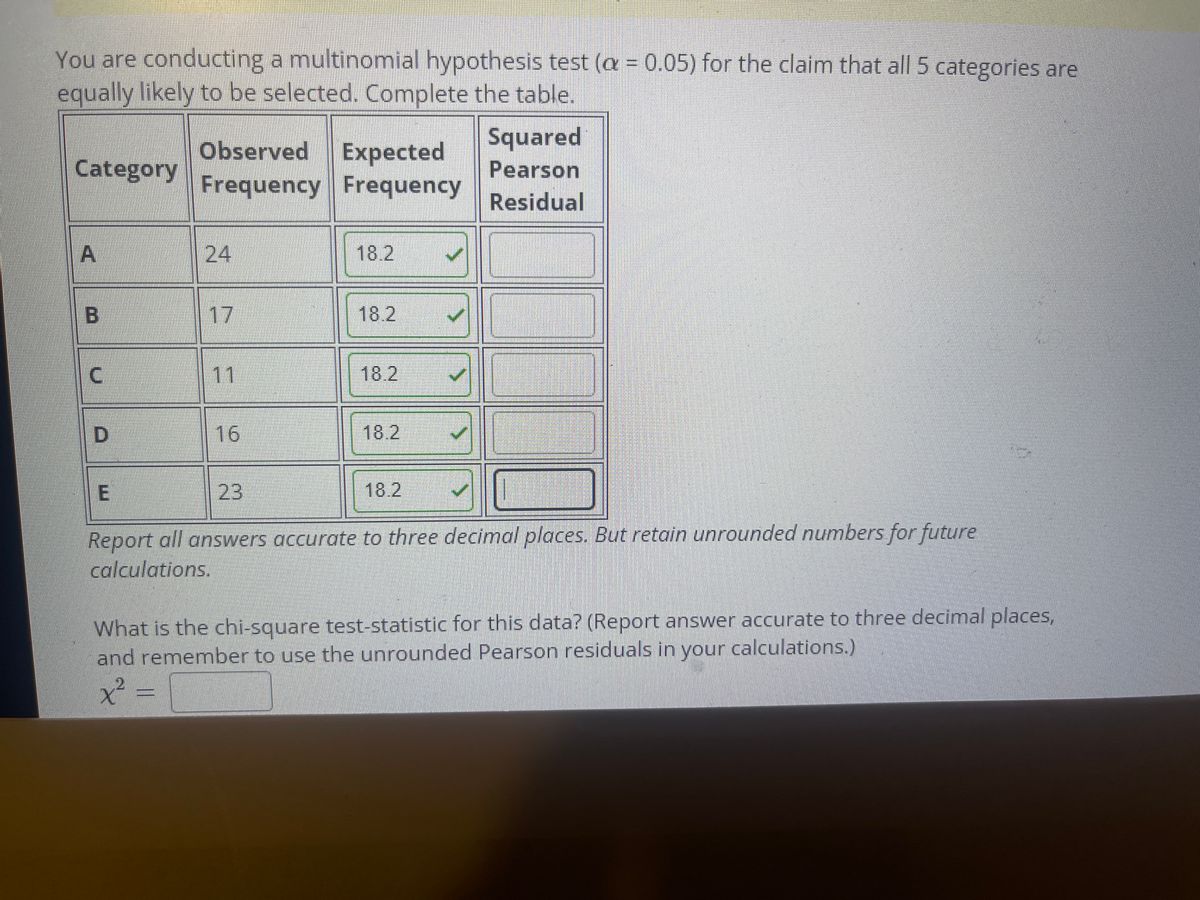

Transcribed Image Text:You are conducting a multinomial hypothesis test (a = 0.05) for the claim that all 5 categories are
equally likely to be selected. Complete the table.
Observed Expected
Frequency Frequency
Squared
Pearson
Residual
Category
24
18.2
B
17
18.2
11
18.2
D.
18.2
23
18.2
Report all answers accurate to three decimal places. But retain unrounded numbers for future
calculations.
What is the chi-square test-statistic for this data? (Report answer accurate to three decimal places,
and remember to use the unrounded Pearson residuals in your calculations.)
16
E.
A,
Expert Solution
This question has been solved!
Explore an expertly crafted, step-by-step solution for a thorough understanding of key concepts.

Step by stepSolved in 4 steps

Knowledge Booster

Similar questions
- Expected return and standard deviation. Use the following information to answer the questions: a. What is the expected return of each asset? b. What is the variance of each asset? - X c. What is the standard deviation of each asset? Data Table swers you will type. Hint: Make sure to round all intermediate calculatio a. What is the expected return of asset A? (Click on the following icon in order to copy its contents into a spreadsheet.) (Round to four decimal places.) Return on Return on Return on Asset C in State State of Probability Asset A in Asset B in Economy of State State State Boom 0.34 0.05 0.21 0.27 Normal 0.45 0.05 0.06 0.21 Recession 0.21 0.05 -0.03 -0.22 | Print Donearrow_forwardWhich of the following is an accurate definition for the power of a statistic test?arrow_forwardOne of the following is an example of a question that might be asked to ascertain a problem with a nonrepresentative sample. Which one? O Do the signs of the residuals alternate? O Does the population have an omitted variable? O Do the residuals show nonconstant variance? O Does the sample contain about the same geographic coverage as the population?arrow_forward
- Answer the chi-square questions using the data below. Use an ? of 0.10? B A 1 2 3 4 1 20 29 11 19 2 9 18 24 21 a) What is the appropriate test statistic? ---Select--- na z-test One-Sample t-test Independent-Samples t-test Related-Samples t-test One-Way ANOVA Within-Subjects ANOVA Two-Way ANOVA Correlation Slope Chi-Square GoF Chi-Square IndependenceCompute the statistic selected in a): b) Obtain/compute the appropriate values to make a decision about H0.Critical Value = ; Test Statistic = Decision: ---Select--- Reject H0 Fail to reject H0c) Compute the corresponding effect size(s) and indicate magnitude(s).If not appropriate, input and/or select "na" below.Effect Size = ; Magnitude: ---Select--- na trivial effect small effect medium effect large effectarrow_forwardWhich of the following is not needed to compute a t statistic? Question 18 options: A hypothesized value for the population mean The value of the population variance or standard deviation The value of the sample mean The value of the sample variance or standard deviationarrow_forwardChoose the appropriate statistical test. When computing, be sure to round each answer as indicated. A dentist wonders if depression affects ratings of tooth pain. In the general population, using a scale of 1-10 with higher values indicating more pain, the average pain rating for patients with toothaches is 6.8. A sample of 30 patients that show high levels of depression have an average pain rating of 7.1 (variance 0.8). What should the dentist determine? 1. Calculate the estimated standard error. (round to 3 decimals). [st.error] 2. What is thet-obtained? (round to 3 decimals). 3. What is the t-cv? (exact value) 4. What is your conclusion? Only type "Reject" or Retain"arrow_forward
- * Question Completion Status: QUESTION 12 In a random sample of 10 adults each of them ate 100 g of dark chocolate and in another random sample of 15 adults each of them a chocolate. After one hour their blood plasma antioxidant capacity was measured and the summary statistics are given below. ate 100 g of milk Sample standard deviation 6.2 7.2 Sample mean Dark chocolate (DC) Milk chocolate (MC) 171.5 160.0 At 5% significance level do the data provide sufficient evidence that dark chocolate produces a higher mean level of total blood plasma capacity than milk chocolate? Assume that the population distributions are normal with equal variance. antioxidant a. The altemative hypothesis is H1: PDarkc (arrow_forwardConsider the following data: −10, −10, 0, 3, −10, 3, 3 Step 1 of 3: Calculate the value of the sample Variance. Round your answer to one decimal place. Step 2 of 3: Calculate the value of the sample deviation. Round your answer to one decimal place. Step 3 of 3: Calculate the value of the range.arrow_forwardQuestion H The number of chocolate chips in a bag of chocolate chip cookies is approximately normally distributed with a mean of 1261 chips and a standard deviation of 118 chips. (a) Determine the 28th percentile for the number of chocolate chips in a bag. (b) Determine the number of chocolate chips in a bag that make up the middle 96% of bags. (c) What is the interquartile range of the number of chocolate chips in a bag of chocolate chip cookies? (a) The 28th percentile for the number of chocolate chips in a bag of chocolate chip cookies is (Round to the nearest whole number as needed.) chocolate chips. (b) The number of chocolate chips in a bag that make up the middle 96% of bags is | (Round to the nearest whole number as needed. Use ascending order.) chocolate chips. to (c) The interquartile range of the number of chocolate chips is (Round to the nearest whole number as needed.) Enter your answer in each of the answer boxes. 11:59pm thase Options A0.50LA Type here to searcharrow_forwardarrow_back_iosSEE MORE QUESTIONSarrow_forward_ios
Recommended textbooks for you
- A First Course in Probability (10th Edition)ProbabilityISBN:9780134753119Author:Sheldon RossPublisher:PEARSON

A First Course in Probability (10th Edition)
Probability
ISBN:9780134753119
Author:Sheldon Ross
Publisher:PEARSON