MATLAB: An Introduction with Applications
6th Edition
ISBN: 9781119256830
Author: Amos Gilat
Publisher: John Wiley & Sons Inc
expand_more
expand_more
format_list_bulleted
Question
thumb_up100%

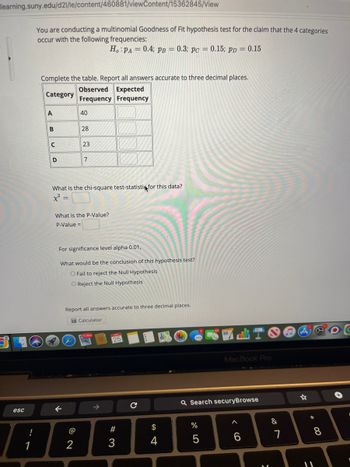
Transcribed Image Text:learning.suny.edu/d21/le/content/460881/viewContent/15362845/View
esc
!
You are conducting a multinomial Goodness of Fit hypothesis test for the claim that the 4 categories
occur with the following frequencies:
Ho: PA= 0.4; PB = 0.3; pc = 0.15; pp = 0.15
Complete the table. Report all answers accurate to three decimal places.
Category
Observed Expected
Frequency Frequency
A
B
C
D
40
28
←
23
What is the chi-square test-statistin for this data?
x² =
7
What is the P-Value?
P-Value =
2
For significance level alpha 0.01,
What would be the conclusion of this hypothesis test?
O Fail to reject the Null Hypothesis
O Reject the Null Hypothesis
Report all answers accurate to three decimal places.
Calculator
25
#3
$
4
16. C
Q Search securyBrowse
%
MacBook Pro
5
A
-
&
7
* 00
8
Expert Solution
This question has been solved!
Explore an expertly crafted, step-by-step solution for a thorough understanding of key concepts.
This is a popular solution
Trending nowThis is a popular solution!
Step by stepSolved in 3 steps with 2 images

Knowledge Booster
Similar questions
- You are playing a dice game with a friend and become suspicious that he is using weighted dice. So you stop the game, take one of his dice, and roll it 100 times. The results are in the table below. Do these results provide significant evidence that the proportion of times the dice lands on the six numbers are unequal? Calculate the chi-squared test statistic and the range the p-value falls in for this test. Number on die 1 2 4 Frequency 16 21 6 26 13 18 test statistic = 14.12, p-value in (.01, .025) test statistic = 24.368, p-value in (.005, .01) test statistic = 14.12, p-value in (.025, 05) test statistic = 24.368, p-value less than .005 O none of thesearrow_forwardAlso this after the 2nd picture. (c) By hand, make a histogram and using this histogram select the correct description of the age at which women have their first child. The distribution is: (d) In which age classes do the median and quartiles fall in the ordered list of all maternal ages? Median falls within: Q1 falls within: Q3 falls within:arrow_forwardJust answer: According to the P value, what is the mean difference statistically significant? Based on the results, can you reject the null hypothesis? Is the entire staff operating at a good level?arrow_forward
- #4arrow_forwardThe chi-square statistic for these data is x = 8.134. Which of the following intervals contains the P- value for this test? Color preference Pink Blue Yellow Green Total Female 48 24 18 30 120 Gender Male 55 34 18 116 Total 103 58 27 48 236 0.025 0.1arrow_forwardData set 18 includes "attractive" ratings of male dates by the female dates. The summary statistics are n=199, x-6.19, s-1.99. Use a 0.01 significance level to test the claim that the population mean of such ratings is less than 7 Find H, and H₁ for this claim. O Ho: mean>7, H1: mean-7 Ho: mean7 Ho: mean-7, H1: mean<7 2arrow_forward
arrow_back_ios
arrow_forward_ios
Recommended textbooks for you
 MATLAB: An Introduction with ApplicationsStatisticsISBN:9781119256830Author:Amos GilatPublisher:John Wiley & Sons Inc
 Probability and Statistics for Engineering and th...StatisticsISBN:9781305251809Author:Jay L. DevorePublisher:Cengage Learning
 Statistics for The Behavioral Sciences (MindTap C...StatisticsISBN:9781305504912Author:Frederick J Gravetter, Larry B. WallnauPublisher:Cengage Learning
 Elementary Statistics: Picturing the World (7th E...StatisticsISBN:9780134683416Author:Ron Larson, Betsy FarberPublisher:PEARSON
 The Basic Practice of StatisticsStatisticsISBN:9781319042578Author:David S. Moore, William I. Notz, Michael A. FlignerPublisher:W. H. Freeman
 Introduction to the Practice of StatisticsStatisticsISBN:9781319013387Author:David S. Moore, George P. McCabe, Bruce A. CraigPublisher:W. H. Freeman

MATLAB: An Introduction with Applications
Statistics
ISBN:9781119256830
Author:Amos Gilat
Publisher:John Wiley & Sons Inc

Probability and Statistics for Engineering and th...
Statistics
ISBN:9781305251809
Author:Jay L. Devore
Publisher:Cengage Learning

Statistics for The Behavioral Sciences (MindTap C...
Statistics
ISBN:9781305504912
Author:Frederick J Gravetter, Larry B. Wallnau
Publisher:Cengage Learning

Elementary Statistics: Picturing the World (7th E...
Statistics
ISBN:9780134683416
Author:Ron Larson, Betsy Farber
Publisher:PEARSON

The Basic Practice of Statistics
Statistics
ISBN:9781319042578
Author:David S. Moore, William I. Notz, Michael A. Fligner
Publisher:W. H. Freeman

Introduction to the Practice of Statistics
Statistics
ISBN:9781319013387
Author:David S. Moore, George P. McCabe, Bruce A. Craig
Publisher:W. H. Freeman