
MATLAB: An Introduction with Applications
6th Edition
ISBN: 9781119256830
Author: Amos Gilat
Publisher: John Wiley & Sons Inc
expand_more
expand_more
format_list_bulleted
Related questions
Concept explainers
Topic Video
Question
thumb_up100%
I got values like the second picture by using LINEST. How to answer for b?
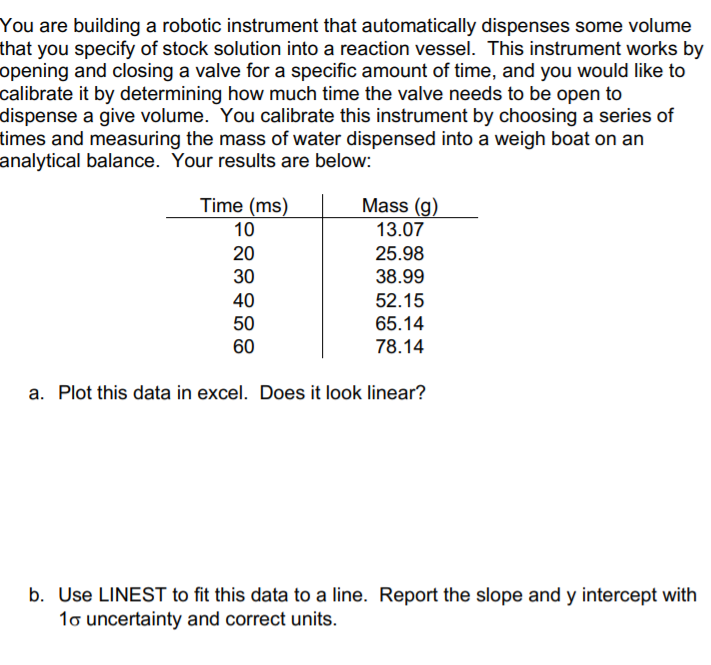

Transcribed Image Text:You are building a robotic instrument that automatically dispenses some volume
that you specify of stock solution into a reaction vessel. This instrument works by
opening and closing a valve for a specific amount of time, and you would like to
calibrate it by determining how much time the valve needs to be open to
dispense a give volume. You calibrate this instrument by choosing a series of
times and measuring the mass of water dispensed into a weigh boat on an
analytical balance. Your results are below:
Time (ms)
Mass (g)
10
13.07
20
25.98
30
38.99
40
52.15
50
60
65.14
78.14
a. Plot this data in excel. Does it look linear?
b. Use LINEST to fit this data to a line. Report the slope and y intercept with
1o uncertainty and correct units.

Transcribed Image Text:1.302828571 -0.0206667 Slope
intercept
0.001525118 0.05939483 se(slope)
se(intercept)
0.999994519 0.06380028 r^2
se(y)
se =
standard errrors
729738.6995
4 F
df
2970.384001
0.0162819 ss reg
ss resid
Expert Solution
This question has been solved!
Explore an expertly crafted, step-by-step solution for a thorough understanding of key concepts.

Step by stepSolved in 3 steps

Knowledge Booster


Learn more about
Need a deep-dive on the concept behind this application? Look no further. Learn more about this topic, statistics and related others by exploring similar questions and additional content below.Similar questions
- Find the measure of the complement and the supplement of 2 degrees.arrow_forwardFind values of X and Yarrow_forwardElizabeth found a picture frame on sale. She wants to know if her poster will fit inside the frame, but she left the poster at home. In the image, the blue rectangle represents the frame (perimeter = 43) and the purple rectangle represents the poster. Find x and determine if the poster will fit in the frame. No, the poster will not fit in the frame. x = 6 Yes, the poster will fit in the frame. x = 14.5 No, the poster will not fit in the frame. x = 2.5 Yes, the poster will fit in the frame. x = 2.5arrow_forward
arrow_back_ios
arrow_forward_ios
Recommended textbooks for you
- MATLAB: An Introduction with ApplicationsStatisticsISBN:9781119256830Author:Amos GilatPublisher:John Wiley & Sons Inc
 Probability and Statistics for Engineering and th...StatisticsISBN:9781305251809Author:Jay L. DevorePublisher:Cengage Learning
 Statistics for The Behavioral Sciences (MindTap C...StatisticsISBN:9781305504912Author:Frederick J Gravetter, Larry B. WallnauPublisher:Cengage Learning
  Elementary Statistics: Picturing the World (7th E...StatisticsISBN:9780134683416Author:Ron Larson, Betsy FarberPublisher:PEARSON
 The Basic Practice of StatisticsStatisticsISBN:9781319042578Author:David S. Moore, William I. Notz, Michael A. FlignerPublisher:W. H. Freeman
 Introduction to the Practice of StatisticsStatisticsISBN:9781319013387Author:David S. Moore, George P. McCabe, Bruce A. CraigPublisher:W. H. Freeman
MATLAB: An Introduction with Applications
Statistics
ISBN:9781119256830
Author:Amos Gilat
Publisher:John Wiley & Sons Inc
Probability and Statistics for Engineering and th...
Statistics
ISBN:9781305251809
Author:Jay L. Devore
Publisher:Cengage Learning
Statistics for The Behavioral Sciences (MindTap C...
Statistics
ISBN:9781305504912
Author:Frederick J Gravetter, Larry B. Wallnau
Publisher:Cengage Learning
Elementary Statistics: Picturing the World (7th E...
Statistics
ISBN:9780134683416
Author:Ron Larson, Betsy Farber
Publisher:PEARSON
The Basic Practice of Statistics
Statistics
ISBN:9781319042578
Author:David S. Moore, William I. Notz, Michael A. Fligner
Publisher:W. H. Freeman
Introduction to the Practice of Statistics
Statistics
ISBN:9781319013387
Author:David S. Moore, George P. McCabe, Bruce A. Craig
Publisher:W. H. Freeman