
MATLAB: An Introduction with Applications
6th Edition
ISBN: 9781119256830
Author: Amos Gilat
Publisher: John Wiley & Sons Inc
expand_more
expand_more
format_list_bulleted
Related questions
Question
Feedback: please don't send a handwritten note. handwriting sometimes difficult to understand
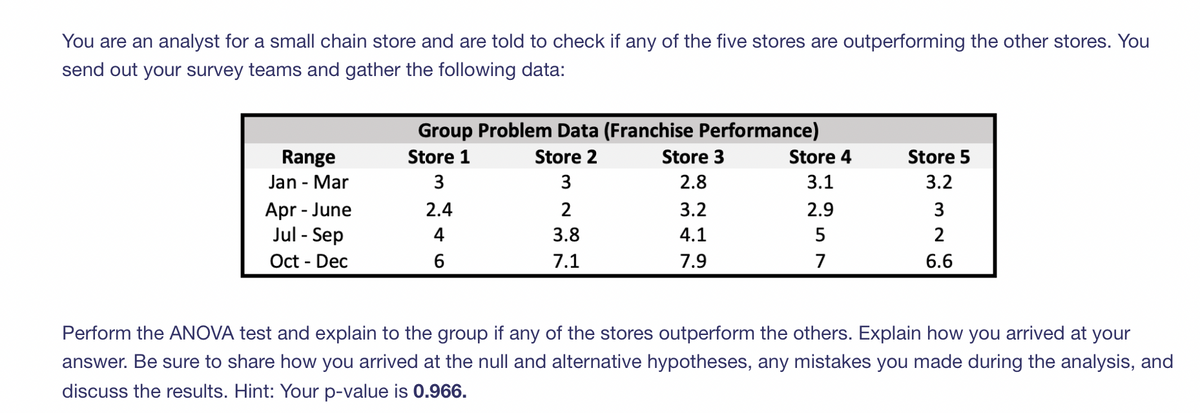

Transcribed Image Text:You are an analyst for a small chain store and are told to check if any of the five stores are outperforming the other stores. You
send out your survey teams and gather the following data:
Range
Jan - Mar
Apr - June
Jul - Sep
Oct - Dec
Group Problem Data (Franchise Performance)
Store 1
Store 2
3
3
2.4
4
6
2
3.8
7.1
Store 3
2.8
3.2
4.1
7.9
Store 4
3.1
2.9
5
7
Store 5
3.2
3
2
6.6
Perform the ANOVA test and explain to the group if any of the stores outperform the others. Explain how you arrived at your
answer. Be sure to share how you arrived at the null and alternative hypotheses, any mistakes you made during the analysis, and
discuss the results. Hint: Your p-value is 0.966.
Expert Solution
This question has been solved!
Explore an expertly crafted, step-by-step solution for a thorough understanding of key concepts.

Step by stepSolved in 2 steps with 4 images

Knowledge Booster

Similar questions
- Please do not give solution in image format thanku You want to host a giveaway on Facebook to promote your new side hustle. You are giving away a $50 gift card for your business. Anyone who likes/follows your Facebook page is entered into the drawing. According to a recent study, you predict your side hustle will earn, on average, $.50 per like/follow. Your giveaway deadline passes, and you have 189 new followers on your Facebook page since the giveaway was first promoted. Using expected value, answer the following: Was this a successful giveaway (in terms of expected value)? How many followers would have made this giveaway a “fair game”? What would the expected value have been if you only gained 94 new followers?arrow_forwardFill in the blanks. The variable is the variable whose value can be explained by the OA. predictor; response OB. response; lurking C. lurking; response O D. response; predictor variable.arrow_forwardThank youarrow_forward
Recommended textbooks for you
- MATLAB: An Introduction with ApplicationsStatisticsISBN:9781119256830Author:Amos GilatPublisher:John Wiley & Sons Inc
 Probability and Statistics for Engineering and th...StatisticsISBN:9781305251809Author:Jay L. DevorePublisher:Cengage Learning
 Statistics for The Behavioral Sciences (MindTap C...StatisticsISBN:9781305504912Author:Frederick J Gravetter, Larry B. WallnauPublisher:Cengage Learning
  Elementary Statistics: Picturing the World (7th E...StatisticsISBN:9780134683416Author:Ron Larson, Betsy FarberPublisher:PEARSON
 The Basic Practice of StatisticsStatisticsISBN:9781319042578Author:David S. Moore, William I. Notz, Michael A. FlignerPublisher:W. H. Freeman
 Introduction to the Practice of StatisticsStatisticsISBN:9781319013387Author:David S. Moore, George P. McCabe, Bruce A. CraigPublisher:W. H. Freeman
MATLAB: An Introduction with Applications
Statistics
ISBN:9781119256830
Author:Amos Gilat
Publisher:John Wiley & Sons Inc
Probability and Statistics for Engineering and th...
Statistics
ISBN:9781305251809
Author:Jay L. Devore
Publisher:Cengage Learning
Statistics for The Behavioral Sciences (MindTap C...
Statistics
ISBN:9781305504912
Author:Frederick J Gravetter, Larry B. Wallnau
Publisher:Cengage Learning
Elementary Statistics: Picturing the World (7th E...
Statistics
ISBN:9780134683416
Author:Ron Larson, Betsy Farber
Publisher:PEARSON
The Basic Practice of Statistics
Statistics
ISBN:9781319042578
Author:David S. Moore, William I. Notz, Michael A. Fligner
Publisher:W. H. Freeman
Introduction to the Practice of Statistics
Statistics
ISBN:9781319013387
Author:David S. Moore, George P. McCabe, Bruce A. Craig
Publisher:W. H. Freeman