MATLAB: An Introduction with Applications
6th Edition
ISBN: 9781119256830
Author: Amos Gilat
Publisher: John Wiley & Sons Inc
expand_more
expand_more
format_list_bulleted
Question

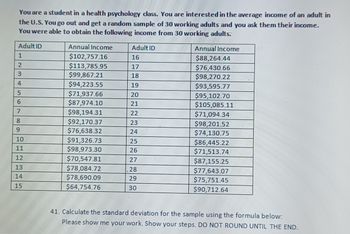
Transcribed Image Text:You are a student in a health psychology class. You are interested in the average income of an adult in
the U.S. You go out and get a random sample of 30 working adults and you ask them their income.
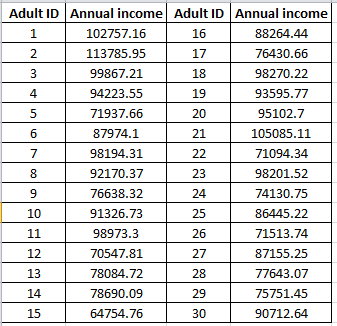
You were able to obtain the following income from 30 working adults:
Adult ID
1
2
3
4
5
6
7
8
9
10
11
12
13
14
15
Annual Income
$102,757.16
$113,785.95
$99,867.21
$94,223.55
$71,937.66
$87,974.10
$98,194.31
$92,170.37
$76,638.32
$91,326.73
$98,973.30
$70,547.81
$78,084.72
$78,690.09
$64,754.76
Adult ID
16
17
18
19
20
21
22
23
24
25
26
27
28
29
30
Annual Income
$88,264.44
$76,430.66
$98,270.22
$93,595.77
$95,102.70
$105,085.11
$71,094.34
$98,201.52
$74,130.75
$86,445.22
$71,513.74
$87,155.25
$77,643.07
$75,751.45
$90,712.64
41. Calculate the standard deviation for the sample using the formula below:
Please show me your work. Show your steps. DO NOT ROUND UNTIL THE END.
Expert Solution
arrow_forward
Step 1: Determine the given variables.
The question is about measures.
Given :

To find :
Value of sample standard deviation.
Step by stepSolved in 3 steps with 5 images

Knowledge Booster
Similar questions
- The General Social Survey is an annual survey given to a random selection of about 1500 adults in the United States. Among the many questions asked are "What is the highest level of education you've completed?" and "If you're employed full-time, how many hours do you spend working at your job during a typical week?" We're interested in examining whether or not there are differences in the typical work week length based on the level of education of the worker. We perform a one-way, independent-samples ANOVA test, with the "groups" in the ANOVA being categories of highest educational degree of the worker ("less than high school," "bachelor's degree," etc.) and the variable being the number of hours written down by the worker in answering the survey question. (a)Suppose that the results of our ANOVA are given in the ANOVA table below. Complete the missing cell of the ANOVA table (rounding your answer to two decimal places). Source of variation Degrees of freedom Sum of…arrow_forwardI need help with something regarding this problem. The National Sleep Foundation recommends that adults aged 18 to 64 get an average of 8 hours of sleep per night. A survey of sleep hours was taken during a Statistics class. The data is listed below: 4, 5, 5, 5, 5.5, 6, 6, 6, 6, 7, 7, 7, 7, 7, 7, 7, 8, 8, 8, 8, 9, 9, 9, 10, 10 Do we have enough evidence at the 0.05 significance level to say that statistics students tend to get less sleep than the recommended average of 8 hours per night? How would I get the degrees of freedom?arrow_forwardQuestion: In a class of 50 students, the scores on a statistics exam are as follows: 10 students scored 80, 15 students scored 70, 20 students scored 60, and the rest scored 50. What is the mean score on the exam?arrow_forward
- You want to examine the relationship between dropping out of high school and delinquency. You have a random sample of 11 students. You have the number of delinquent offenses that each student reported committing in the year before and after dropping out of school. The following table shows the data. Student Before dropping out After dropping out 1 5 7 2 9 5 3 2 3 4 7 7 5 8 11 6 11 13 7 8 4 8 8 10 9 5 7 10 2 1 11 9 3 From performing a hypothesis test to determine if the mean number of delinquent differs after dropping out, what is the obtained t?arrow_forwardNeed help urgently pleasearrow_forwardCan you do a histogram for Class 0-0.19, 0.20-0.39, 0.40-0.59, 0.60-0.79,0.80-0.99, 1.00-1.19, 1.20-1.39, Frequencies 25, 13, 5, 2, 2, 2, 3.arrow_forward
- 1. We are interested in determining if absences from a class affect your overall class grade. The following data from 10 students is provided: Absences Grade 89.2 1 83.7 83.5 81.1 4 78.2 73.9 6 64.3 7 71.8 8 55.9 65.2arrow_forwardPlease assist with all questions and workings to learnarrow_forwardExamples of population or sample? A. The types of cars driven by ur classmates B. The wt of five out of 33 tomatoes at the store C. A recent poll of 100 students in the US on studying habitsarrow_forward
- The General Social Survey is an annual survey given to a random selection of about 1500 adults in the United States. Among the many questions asked are "What is the highest level of education you've completed?" and "If you're employed full-time, how many hours do you spend working at your job during a typical week?" In a recent year, 1079 respondents answered both questions. The summary statistics are given in the chart below. (The sample data consist of the times, in hours per week, that were given by the respondents.) Sample Sample Sample size Groups mean variance Less than h.s. High school Bachelor's 258 40.9 101.8 263 41.8 97.5 270 42.2 94.4 Graduate 288 43.0 98.7 Send data to calculator Send data to Excel To decide if there are any differences in the mean hours per week worked by these different groups, we can perform a one-way, independent-samples ANOVA test. Such a test uses the following statistic. Variation between the samples F= Variation within the samples For the data from…arrow_forwardA random sample of 10 compact cars, 10 mid-size cars, and 10 luxury cars were selected. The time (in seconds) each of the randomly selected cars required to accelerate from 0 to 60 mph was looked up on the Autos.com website. The results are presented below. Car Type Time (in seconds) Required to Accelerate from 0 to 60 mph Compact 9.3 8.1 10.2 8.8 9.0 9.3 7.7 9.2 9.4 8.6 Mid-Size 6.9 5.7 8.3 7.7 8.6 5.9 6.1 8.8 6.1 7.2 Luxury 5.7 6.3 5.4 4.7 6.2 7.0 5.9 5.3 6.3 5.0 Conduct a hypothesis test using ! = 0.05 to determine whether the mean time required to accelerate from 0 to 60 mph is the same for compact, mid-size, and luxury cars. (No accounting or excel, I need help solving it.)arrow_forwardA Statistics class reports the following data on Sex and Eye Color for students in the class: Green/Hazel/Other Total Blue 8 Brown 20 34 4 16 32 36 66 Males Females Total 12 16 12 18 a. What percent of the blue-eyed students are male? type your answer... % b. What percent of the class are blue-eyed males? % type your answer... c. What percent of the male students have blue eyes? type your answer... % d. What percent of the students who do not have blue eyes are females? % type your answer... e. What's the conditional distribution of sex for the brown-eyed students? Male: type your answer... % Female: type your answer... % f. What's the conditional distribution of Eye Color for the males? Blue: type your answer... Brown: type your answer... % %arrow_forward
arrow_back_ios
SEE MORE QUESTIONS
arrow_forward_ios
Recommended textbooks for you
 MATLAB: An Introduction with ApplicationsStatisticsISBN:9781119256830Author:Amos GilatPublisher:John Wiley & Sons Inc
 Probability and Statistics for Engineering and th...StatisticsISBN:9781305251809Author:Jay L. DevorePublisher:Cengage Learning
 Statistics for The Behavioral Sciences (MindTap C...StatisticsISBN:9781305504912Author:Frederick J Gravetter, Larry B. WallnauPublisher:Cengage Learning
 Elementary Statistics: Picturing the World (7th E...StatisticsISBN:9780134683416Author:Ron Larson, Betsy FarberPublisher:PEARSON
 The Basic Practice of StatisticsStatisticsISBN:9781319042578Author:David S. Moore, William I. Notz, Michael A. FlignerPublisher:W. H. Freeman
 Introduction to the Practice of StatisticsStatisticsISBN:9781319013387Author:David S. Moore, George P. McCabe, Bruce A. CraigPublisher:W. H. Freeman

MATLAB: An Introduction with Applications
Statistics
ISBN:9781119256830
Author:Amos Gilat
Publisher:John Wiley & Sons Inc

Probability and Statistics for Engineering and th...
Statistics
ISBN:9781305251809
Author:Jay L. Devore
Publisher:Cengage Learning

Statistics for The Behavioral Sciences (MindTap C...
Statistics
ISBN:9781305504912
Author:Frederick J Gravetter, Larry B. Wallnau
Publisher:Cengage Learning

Elementary Statistics: Picturing the World (7th E...
Statistics
ISBN:9780134683416
Author:Ron Larson, Betsy Farber
Publisher:PEARSON

The Basic Practice of Statistics
Statistics
ISBN:9781319042578
Author:David S. Moore, William I. Notz, Michael A. Fligner
Publisher:W. H. Freeman

Introduction to the Practice of Statistics
Statistics
ISBN:9781319013387
Author:David S. Moore, George P. McCabe, Bruce A. Craig
Publisher:W. H. Freeman