MATLAB: An Introduction with Applications
6th Edition
ISBN: 9781119256830
Author: Amos Gilat
Publisher: John Wiley & Sons Inc
expand_more
expand_more
format_list_bulleted
Concept explainers
Topic Video
Question
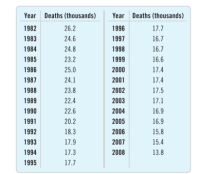
Drunk driving 2008 Accidents involving drunk drivers
account for about 40% of all deaths on the nation’s high-
ways. The table below tracks the number of alcohol-
related fatalities for 26 years. (www.alcoholalert.com)a) Create a stem-and-leaf display or a histogram of these
data.
b) Create a timeplot.
c) Using features apparent in the stem-and-leaf display
(or histogram) and the timeplot, write a few sentences
about deaths caused by drunk driving.

Transcribed Image Text:Year Deaths (thousands)
Year Deaths (thousands)
1982
26.2
1996
17.7
1983
24.6
1997
16.7
1984
24.8
1998
16.7
1985
23.2
1999
16.6
1986
25.0
2000
17.4
1987
24.1
2001
17.4
1988
23.8
2002
17.5
1989
22.4
2003
17.1
1990
22.6
2004
16.9
1991
20.2
2005
16.9
1992
18.3
2006
15.8
1993
17.9
2007
15.4
1994
17.3
2008
13.8
1995
17.7
Expert Solution
This question has been solved!
Explore an expertly crafted, step-by-step solution for a thorough understanding of key concepts.
This is a popular solution
Trending nowThis is a popular solution!
Step by stepSolved in 4 steps with 3 images

Knowledge Booster
Learn more about
Need a deep-dive on the concept behind this application? Look no further. Learn more about this topic, statistics and related others by exploring similar questions and additional content below.Similar questions
- What type of data (categorical, discrete numerical, continuous numerical) is each of the following variables? If there is any ambiguity about the data type, explain why the answer is unclear. Your college program. The number of college credits you have earned. Length of a TV commercial. The country with the most 2021 Olympic medalsarrow_forwardidentify which data sets you would display with a bar graph and which you would display with a histogramarrow_forwardIdentify an important reason for grouping data.arrow_forward
- Typed please and asaparrow_forwardCan you do a histogram for Class 0-0.19, 0.20-0.39, 0.40-0.59, 0.60-0.79,0.80-0.99, 1.00-1.19, 1.20-1.39, Frequencies 25, 13, 5, 2, 2, 2, 3.arrow_forwardWhich of these can help you visualize data? Select all that apply. O bank statement O circle graph O spreadsheet O table O bar grapharrow_forward
- Please solve and explain #2arrow_forwardHow do I find the number of classes in a frequency histogram.arrow_forwardIn a recent article you see a histogram graph that displayed the average number of hours teens get in a night. The graph is a form of what type of statistics? Descriptive or Inferentialarrow_forward
- (a) What is the median starting salary? 41,41,55,45,42,39,38,44,42,32 The median starting salary is: $ thousands of dollars(b) Which of the following would you use to display the data?A. pie chartB. contingency tableC. histogramD. bar grapharrow_forwardIs the following nominal, ordinal, or interval data? Explain your answer. Stock pricesarrow_forwardIn a study, researchers wanted to measure the effect of alcohol on the hippocampal region, the portion of the brain responsible for long-term memory storage, in adolescents. The researchers randomly selected 23 adolescents with alcohol use disorders to determine whether the hippocampal volumes in the alcoholic adolescents were less than the normal volume of 9.02 cm. An analysis of the sample data revealed that the hippocampal volume is approximately normal with no outliers and x 8.18 cm and s=0.8 cm. Conduct the appropriate test at the a= 0.01 level of significance. State the null and alternative hypotheses. Ho: H H1: (Type integers or decimals. Do not round.) Identify the t-statistic. to = (Round to two decimal places as needed.) !! Identify the P-value. P-value = (Round to three decimal places as needed.) Make a conclusion regarding the hypothesis. the null hypothesis. There sufficient evidence to claim that the mean hippocampal volume is cm³ Statcrunch Next 8:01 SAMSUNG esc @ %23 $…arrow_forward
arrow_back_ios
SEE MORE QUESTIONS
arrow_forward_ios
Recommended textbooks for you
 MATLAB: An Introduction with ApplicationsStatisticsISBN:9781119256830Author:Amos GilatPublisher:John Wiley & Sons Inc
 Probability and Statistics for Engineering and th...StatisticsISBN:9781305251809Author:Jay L. DevorePublisher:Cengage Learning
 Statistics for The Behavioral Sciences (MindTap C...StatisticsISBN:9781305504912Author:Frederick J Gravetter, Larry B. WallnauPublisher:Cengage Learning
 Elementary Statistics: Picturing the World (7th E...StatisticsISBN:9780134683416Author:Ron Larson, Betsy FarberPublisher:PEARSON
 The Basic Practice of StatisticsStatisticsISBN:9781319042578Author:David S. Moore, William I. Notz, Michael A. FlignerPublisher:W. H. Freeman
 Introduction to the Practice of StatisticsStatisticsISBN:9781319013387Author:David S. Moore, George P. McCabe, Bruce A. CraigPublisher:W. H. Freeman

MATLAB: An Introduction with Applications
Statistics
ISBN:9781119256830
Author:Amos Gilat
Publisher:John Wiley & Sons Inc

Probability and Statistics for Engineering and th...
Statistics
ISBN:9781305251809
Author:Jay L. Devore
Publisher:Cengage Learning

Statistics for The Behavioral Sciences (MindTap C...
Statistics
ISBN:9781305504912
Author:Frederick J Gravetter, Larry B. Wallnau
Publisher:Cengage Learning

Elementary Statistics: Picturing the World (7th E...
Statistics
ISBN:9780134683416
Author:Ron Larson, Betsy Farber
Publisher:PEARSON

The Basic Practice of Statistics
Statistics
ISBN:9781319042578
Author:David S. Moore, William I. Notz, Michael A. Fligner
Publisher:W. H. Freeman

Introduction to the Practice of Statistics
Statistics
ISBN:9781319013387
Author:David S. Moore, George P. McCabe, Bruce A. Craig
Publisher:W. H. Freeman