Applications and Investigations in Earth Science (9th Edition)
9th Edition
ISBN: 9780134746241
Author: Edward J. Tarbuck, Frederick K. Lutgens, Dennis G. Tasa
Publisher: PEARSON
expand_more
expand_more
format_list_bulleted
Question
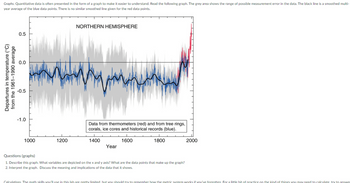
year average of the blue data points. There is no similar smoothed line given for the red data points. Questions graphs) Describe this graph. What variables are depicted on the x and y axis? What are the data points that make up the graph? Interpret the graph. Discuss the meaning and implications of the data that it shows.

Transcribed Image Text:Graphs. Quantitative data is often presented in the form of a graph to make it easier to understand. Read the following graph. The grey area shows the range of possible measurement error in the data. The black line is a smoothed multi-
year average of the blue data points. There is no similar smoothed line given for the red data points.
Departures in temperature (°C)
from the 1961-1990 average
0.5
0.0
-0.5
-1.0
NORTHERN HEMISPHERE
Data from thermometers (red) and from tree rings,
corals, ice cores and historical records (blue).
1000
1200
1400
1600
Year
Questions (graphs)
1800
1. Describe this graph. What variables are depicted on the x and y axis? What are the data points that make up the graph?
2. Interpret the graph. Discuss the meaning and implications of the data that it shows.
2000
Calculations The math skills you'll use in this lab are pretty limited but you should try to remember how the metric system works if you've forgotten. For a little bit of practice on the kind of things you may need to calculate try to answe
Expert Solution
This question has been solved!
Explore an expertly crafted, step-by-step solution for a thorough understanding of key concepts.
Step by stepSolved in 3 steps

Knowledge Booster
Recommended textbooks for you
 Applications and Investigations in Earth Science ...Earth ScienceISBN:9780134746241Author:Edward J. Tarbuck, Frederick K. Lutgens, Dennis G. TasaPublisher:PEARSON
 Exercises for Weather & Climate (9th Edition)Earth ScienceISBN:9780134041360Author:Greg CarbonePublisher:PEARSON
 Environmental ScienceEarth ScienceISBN:9781260153125Author:William P Cunningham Prof., Mary Ann Cunningham ProfessorPublisher:McGraw-Hill Education
 Earth Science (15th Edition)Earth ScienceISBN:9780134543536Author:Edward J. Tarbuck, Frederick K. Lutgens, Dennis G. TasaPublisher:PEARSON
 Environmental Science (MindTap Course List)Earth ScienceISBN:9781337569613Author:G. Tyler Miller, Scott SpoolmanPublisher:Cengage Learning
 Physical GeologyEarth ScienceISBN:9781259916823Author:Plummer, Charles C., CARLSON, Diane H., Hammersley, LisaPublisher:Mcgraw-hill Education,

Applications and Investigations in Earth Science ...
Earth Science
ISBN:9780134746241
Author:Edward J. Tarbuck, Frederick K. Lutgens, Dennis G. Tasa
Publisher:PEARSON

Exercises for Weather & Climate (9th Edition)
Earth Science
ISBN:9780134041360
Author:Greg Carbone
Publisher:PEARSON

Environmental Science
Earth Science
ISBN:9781260153125
Author:William P Cunningham Prof., Mary Ann Cunningham Professor
Publisher:McGraw-Hill Education

Earth Science (15th Edition)
Earth Science
ISBN:9780134543536
Author:Edward J. Tarbuck, Frederick K. Lutgens, Dennis G. Tasa
Publisher:PEARSON

Environmental Science (MindTap Course List)
Earth Science
ISBN:9781337569613
Author:G. Tyler Miller, Scott Spoolman
Publisher:Cengage Learning

Physical Geology
Earth Science
ISBN:9781259916823
Author:Plummer, Charles C., CARLSON, Diane H., Hammersley, Lisa
Publisher:Mcgraw-hill Education,