Algebra and Trigonometry (6th Edition)
6th Edition
ISBN: 9780134463216
Author: Robert F. Blitzer
Publisher: PEARSON
expand_more
expand_more
format_list_bulleted
Concept explainers
Question
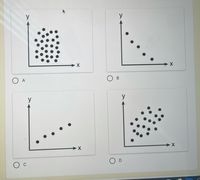
Which scatter plot shows a negative association?

Transcribed Image Text:y
y
В
А
y
y
C
Expert Solution
This question has been solved!
Explore an expertly crafted, step-by-step solution for a thorough understanding of key concepts.
Step by stepSolved in 2 steps with 2 images

Knowledge Booster
Learn more about
Need a deep-dive on the concept behind this application? Look no further. Learn more about this topic, algebra and related others by exploring similar questions and additional content below.Similar questions
- use the sample data to construct a scatterplot. Use the first variable for the x-axis. Based on the scatterplot, what do you conclude about a linear correlation? FORECAST AND ACTUAL TEMPERATURES The table lists actual high temperatures and the high temperatures that were previously forecasted for these same days. The table includes data for ten different days near the author’s home. What does the result suggest about the accuracy of five-day predicted high temperatures?arrow_forwardFind an interesting instance where two variables are strongly correlated, but share no causal link. Explain the situation, describe the variables, and explain why it doesn't make sense for the data to be correlated.arrow_forwardTiffany is a manager who needs to fire the worst performing 3% of employees. At her organization, employee performance is a normally distributed variable. Tiffany should fire employees who have a performance score that correspond with a z-score less than or equal to _____arrow_forward
- ec5arrow_forwardJim and Larry run a soup stand. The data below represents the sales of soup that they had on 8 randomly selected days, along with the high temperature on that day. a) Create a scatter diagram for this data set and comment on whether there is a positive or negative relationship between these variables.b) Calculate the correlation coefficient between temperature and sales.c) Does a linear relationship exist between these variables? Explain to me why or why not this is the case.d) Using excel, calculate the least squares regression equation for this data set. e) Using your equation, predict the soup sales on a day where the temperature is 29 degrees.f) Interpret the slope of this equation.g) Can we use this data set and regression equation to predict the sales on a day when the average temperature is 102 degrees? Why or why not?h) What is the R-squared for this equation? How do you interpret that R-squared?arrow_forwardWhich scatter plot shown has the strongest negative correlation?arrow_forward
- 10. Describe the pattern of data that is observed when there is a strong negative correlation between X and Y.arrow_forwardWhich set of data would probably show a strong positive linear correlation? a) the number of defective light bulbs produced and the time of the day when they were manufactured b) marks on a history test and the heights of the students c) the colour of cars sold and the annual income of the car buyers d) the height of corn in a field and the amount of precipitation during the growing season acerarrow_forwardA food truck owner recorded the temperature at noon, in degrees Fahrenheit, and the number of bowls of soup sold during the lunch hour for a random sample of 5 days. The data are shown in the following table. Temperature (degrees Fahrenheit) 57 75 43 68 67 Number sold 17 12 20 8 13 The mean temperature of the sample is 62 degrees Fahrenheit, and the mean number sold is 14. What is the correlation between the temperature and the number sold? A -0.85 B -0.68 0.68 D 0.73 E 0.85arrow_forward
- Thanks!arrow_forwardWhich set of data would probably show a strong positive linear correlation? a) the number of defective light bulbs produced and the time of the day when they were manufactured b) marks on a history test and the heights of the students c) the colour of cars sold and the annual income of the car buyers d) the height of corn in a field and the amount of precipitation during the growing seasonarrow_forwardr = - 1arrow_forward
arrow_back_ios
SEE MORE QUESTIONS
arrow_forward_ios
Recommended textbooks for you
 Algebra and Trigonometry (6th Edition)AlgebraISBN:9780134463216Author:Robert F. BlitzerPublisher:PEARSON
 Contemporary Abstract AlgebraAlgebraISBN:9781305657960Author:Joseph GallianPublisher:Cengage Learning
 Linear Algebra: A Modern IntroductionAlgebraISBN:9781285463247Author:David PoolePublisher:Cengage Learning
 Algebra And Trigonometry (11th Edition)AlgebraISBN:9780135163078Author:Michael SullivanPublisher:PEARSON
 Introduction to Linear Algebra, Fifth EditionAlgebraISBN:9780980232776Author:Gilbert StrangPublisher:Wellesley-Cambridge Press
 College Algebra (Collegiate Math)AlgebraISBN:9780077836344Author:Julie Miller, Donna GerkenPublisher:McGraw-Hill Education

Algebra and Trigonometry (6th Edition)
Algebra
ISBN:9780134463216
Author:Robert F. Blitzer
Publisher:PEARSON

Contemporary Abstract Algebra
Algebra
ISBN:9781305657960
Author:Joseph Gallian
Publisher:Cengage Learning

Linear Algebra: A Modern Introduction
Algebra
ISBN:9781285463247
Author:David Poole
Publisher:Cengage Learning

Algebra And Trigonometry (11th Edition)
Algebra
ISBN:9780135163078
Author:Michael Sullivan
Publisher:PEARSON

Introduction to Linear Algebra, Fifth Edition
Algebra
ISBN:9780980232776
Author:Gilbert Strang
Publisher:Wellesley-Cambridge Press

College Algebra (Collegiate Math)
Algebra
ISBN:9780077836344
Author:Julie Miller, Donna Gerken
Publisher:McGraw-Hill Education