MATLAB: An Introduction with Applications
6th Edition
ISBN: 9781119256830
Author: Amos Gilat
Publisher: John Wiley & Sons Inc
expand_more
expand_more
format_list_bulleted
Concept explainers
Question
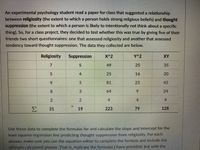
Calculate least squares regression using this information

Transcribed Image Text:**Exploring the Relationship between Religiosity and Thought Suppression**
An experimental psychology student conducted a study to explore a potential relationship between religiosity and thought suppression. Religiosity is defined as the degree to which a person holds strong religious beliefs, while thought suppression is the extent to which a person intentionally avoids thinking about specific topics.
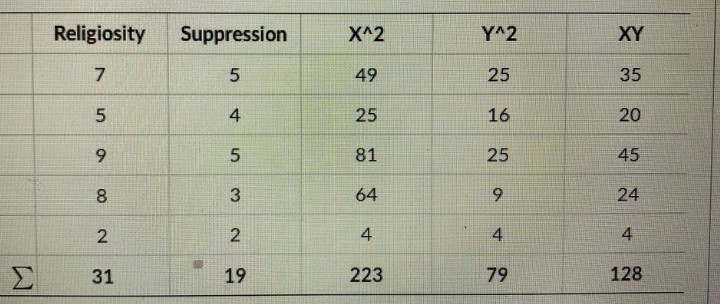
For this study, the student administered two short questionnaires to five friends. One assessed religiosity, and the other evaluated the tendency toward thought suppression. Below is the data collected:
| **Religiosity (X)** | **Suppression (Y)** | **X²** | **Y²** | **XY** |
|--------------------|---------------------|--------|--------|--------|
| 7 | 5 | 49 | 25 | 35 |
| 5 | 4 | 25 | 16 | 20 |
| 9 | 5 | 81 | 25 | 45 |
| 8 | 3 | 64 | 9 | 24 |
| 2 | 2 | 4 | 4 | 4 |
| **Σ** | **31** | **19** | **223**| **79** | **128** |
**Instructions for Analysis**
To analyze this data, calculate the slope and intercept for the least squares regression line that predicts thought suppression from religiosity. Use the formulas provided, ensuring to include the final calculated answer. Replicate the formulas with the correct values.
This analysis will help determine if there is a statistical correlation between the two variables, providing insight into whether stronger religious beliefs may influence the tendency to suppress thoughts.
Expert Solution
arrow_forward
Step 1
Let Y=a+bX
Here a is the intercept and b is the slope.
Let X denote Religiosity and Y denote the suppression.
Here n=5
Given data is,

From the table,
x =31, y=19, x2 =223
,y2 =79 and xy=128
Trending nowThis is a popular solution!
Step by stepSolved in 4 steps with 3 images

Knowledge Booster
Learn more about
Need a deep-dive on the concept behind this application? Look no further. Learn more about this topic, statistics and related others by exploring similar questions and additional content below.Similar questions
- When a stone is dropped in a pond, ripples are formed and travel in concentric circles away from where the stone was dropped. The equation of the least-squares regression line is (picture attached) What is the predicted area of the circle, in cm2, 4 seconds after the stone is dropped? 49.72 cm2 199.43 cm2 311.89 cm2 1854.10 cm2arrow_forwardIs the following statement true or false? If false explain briefly. Some of the residuals from a least squares linear model will be positive and some will be negative. (Don't Hand writing in solution)arrow_forwardA student is preparing to take a stand allies exam she was told that she needs to get plenty of sleep the night before the exam she is interested in the relationship between the number of hours of sleep a student gets her for an exam and the score earned on the exam. She collects information from 10 other students who have already taken the exam as shown on the table. she fits at least squares regression line to the data and determines the equation of the line is why equals 26-0.18 X where why is the score earn on the exam and ask is the number of hours of sleep the night before the exam. The residual is given. based on the residual plot is the linear model appropriate? no, there is no clear pattern in the residual plot. yes, there is no clear pattern in the residual plot. no, the student who got the most you've had a negative residual yes, there are more negative residuals (6) then positive residuals (4)arrow_forward
- Find the least squares regression line for the points. (0, 4), (3, 2), (8, −3) y(x) = Use the regression capabilities of a graphing utility to verify your results. Use the graphing utility to plot the points and graph the regression line. (Select Update Graph to see your response plotted on the screen. Select the Submit button to grade your response.) Update Graph Student Response Graph 10 у H 1 2 3 4 5 6 7 5 Student Response Graph Description -5 8 9 Xarrow_forwardA horizontal least squares regression line, implies that: Select one: a. The slope of the regression equation is 0 * b. None of the above is correct O c. The slope of the regression equation is positive d. The slope of the regression equation is negativearrow_forwardterpreting technology: A biologist computed a least-squares regression line for predicting the brain weight in grams of a bird from its body weight in grams. e results are presented in the following Excel output. Coefficients Intercept 3.74691917 Body Weight 0.08444928 Part: 0 / 2 Part 1 of 2 Write the equation of the least-squares regression line. Use the full accuracy shown in the Excel output (do not round your answers). Regression line equation: y X 3arrow_forward
- An article gave a scatter plot, along with the least squares line, of x = rainfall volume (m³) and y data on rainfall and runoff volume (n = runoff volume (m³) for a particular location. The simple linear regression model provides a very good fit to 15) given below. The equation of the least squares line is y = -2.364 + 0.84267x, ² 0.976, and s = 5.21. = x 5 12 14 17 23 30 40 47 55 67 72 81 96 112 127 y 3 9 12 14 14 24 27 45 38 46 52 71 81 100 101 (a) Use the fact that s = 1.43 when rainfall volume is 40 m³ to predict runoff in a way that conveys information about reliability and precision. (Calculate a 95% PI. Round your answers to two decimal places.) Ŷ 28.25 1x ) m³ Does the resulting interval suggest that precise information about the value of runoff for this future observation is available? Explain your reasoning. OYes, precise information is available because the resulting interval is very wide. 34.46 Yes, precise information is available because the resulting interval is very…arrow_forwardAn engineer is testing a new car model to determine how its fuel efficiency, measured in L/(100 km), is related to its speed, which is measured in km/hour. The engineer calculates the average speed for 30 trials. The average speed is an example of a (statistic or parameter) The engineer would like to find the least squares regression line predicting fuel used (y) from speed (x) for the 30 cars he observed. He collected the data below. Speed 62 65 80 82 85 87 90 96 98 100 Fuel 12 13 14 13 14 14 15 15 16 15 Speed 100 102 104 107 112 114 114 117 121 122 Fuel 16 17 16 17 18 17 18 17 18 19 Speed 124 127 127 130 132 137 138 142 144 150 Fuel 18 19 20 19 21 23 22 23 24 26 The regression line equation is Round each number to four decimal places.arrow_forward
arrow_back_ios
arrow_forward_ios
Recommended textbooks for you
 MATLAB: An Introduction with ApplicationsStatisticsISBN:9781119256830Author:Amos GilatPublisher:John Wiley & Sons Inc
 Probability and Statistics for Engineering and th...StatisticsISBN:9781305251809Author:Jay L. DevorePublisher:Cengage Learning
 Statistics for The Behavioral Sciences (MindTap C...StatisticsISBN:9781305504912Author:Frederick J Gravetter, Larry B. WallnauPublisher:Cengage Learning
 Elementary Statistics: Picturing the World (7th E...StatisticsISBN:9780134683416Author:Ron Larson, Betsy FarberPublisher:PEARSON
 The Basic Practice of StatisticsStatisticsISBN:9781319042578Author:David S. Moore, William I. Notz, Michael A. FlignerPublisher:W. H. Freeman
 Introduction to the Practice of StatisticsStatisticsISBN:9781319013387Author:David S. Moore, George P. McCabe, Bruce A. CraigPublisher:W. H. Freeman

MATLAB: An Introduction with Applications
Statistics
ISBN:9781119256830
Author:Amos Gilat
Publisher:John Wiley & Sons Inc

Probability and Statistics for Engineering and th...
Statistics
ISBN:9781305251809
Author:Jay L. Devore
Publisher:Cengage Learning

Statistics for The Behavioral Sciences (MindTap C...
Statistics
ISBN:9781305504912
Author:Frederick J Gravetter, Larry B. Wallnau
Publisher:Cengage Learning

Elementary Statistics: Picturing the World (7th E...
Statistics
ISBN:9780134683416
Author:Ron Larson, Betsy Farber
Publisher:PEARSON

The Basic Practice of Statistics
Statistics
ISBN:9781319042578
Author:David S. Moore, William I. Notz, Michael A. Fligner
Publisher:W. H. Freeman

Introduction to the Practice of Statistics
Statistics
ISBN:9781319013387
Author:David S. Moore, George P. McCabe, Bruce A. Craig
Publisher:W. H. Freeman