
MATLAB: An Introduction with Applications
6th Edition
ISBN: 9781119256830
Author: Amos Gilat
Publisher: John Wiley & Sons Inc
expand_more
expand_more
format_list_bulleted
Related questions
Concept explainers
Question
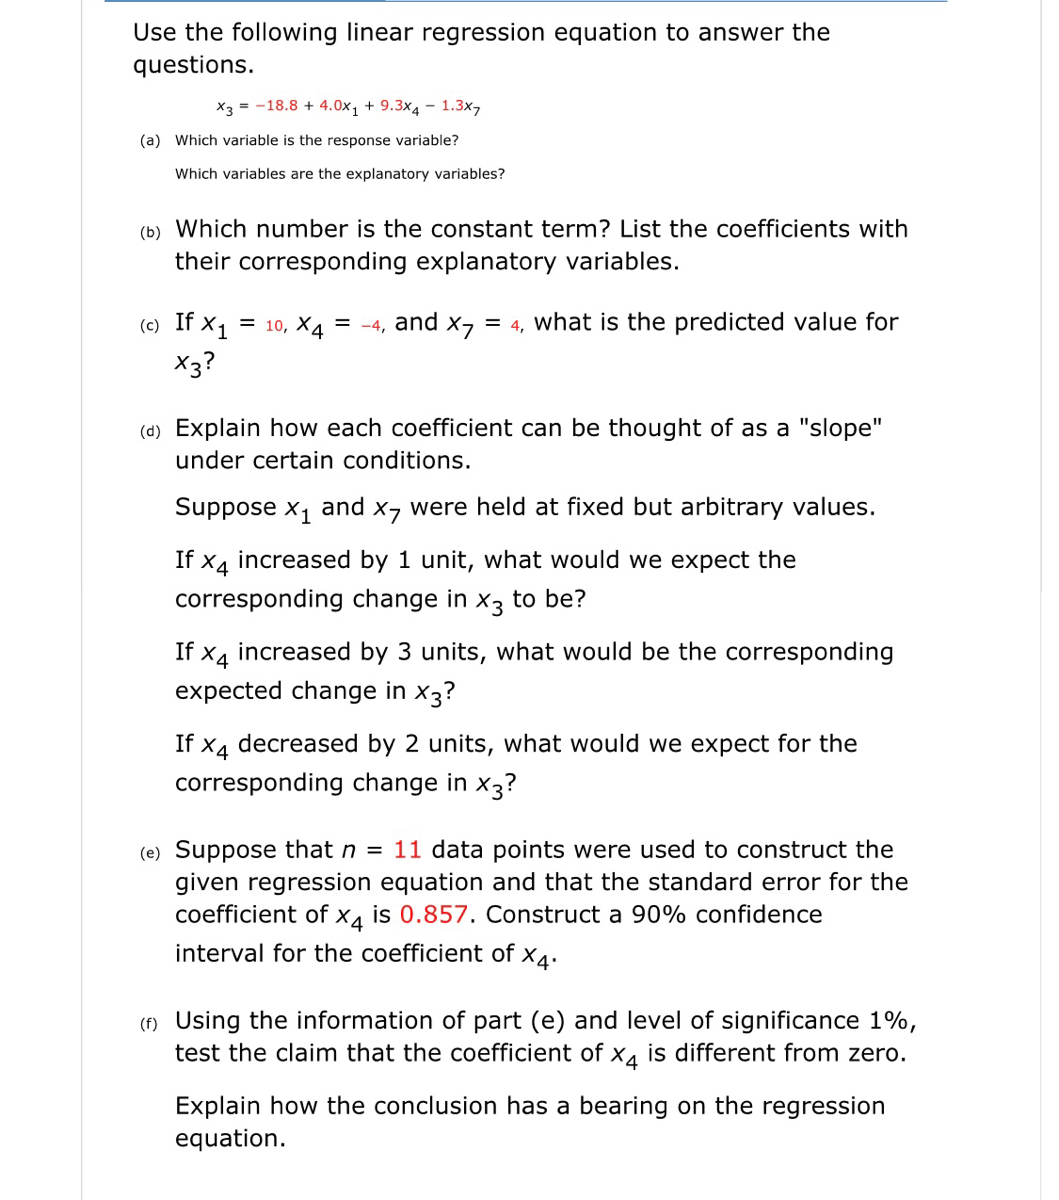

Transcribed Image Text:Use the following linear regression equation to answer the
questions.
x3 = -18.8 + 4.0x, + 9.3x4 - 1.3x7
(a) Which variable is the response variable?
Which variables are the explanatory variables?
(b) Which number is the constant term? List the coefficients with
their corresponding explanatory variables.
(c) If X1
X3?
= 10, X4
= -4, and x7
= 4, what is the predicted value for
(d) Explain how each coefficient can be thought of as a "slope"
under certain conditions.
Suppose x1
and
X7 were held at fixed but arbitrary values.
If x4 increased by 1 unit, what would we expect the
corresponding change in x3 to be?
If x4 increased by 3 units, what would be the corresponding
expected change in x3?
If x4 decreased by 2 units, what would we expect for the
corresponding change in x3?
(e) Suppose that n = 11 data points were used to construct the
given regression equation and that the standard error for the
is 0.857. Construct a 90% confidence
coefficient of
X4
interval for the coefficient of x4.
(f) Using the information of part (e) and level of significance 1%,
test the claim that the coefficient of x4 is different from zero.
Explain how the conclusion has a bearing on the regression
equation.
Expert Solution
This question has been solved!
Explore an expertly crafted, step-by-step solution for a thorough understanding of key concepts.

Step by stepSolved in 2 steps with 2 images

Knowledge Booster


Learn more about
Need a deep-dive on the concept behind this application? Look no further. Learn more about this topic, statistics and related others by exploring similar questions and additional content below.Similar questions
- Sketch a graph of f(x) = 2x + 5x2/5. Which of the following figures represents the curve of this function? Select the correct answer below: -4 -4 -3 -3 -2 -2 -1 -1 0 -3 1 0 -1 0 1 2 3arrow_forwardSuppose B = (8, -7) and AB = (1, -13). Then 0 A=arrow_forwardThe Plush Zo store sells stuffed animals. The store is running a special on teddy bears this month. One day, the shopkeeper took a sample of stuffed animals at the store. She found that 4 of the 15 stuffed animals that she sampled were teddy bears. The store had 590 stuffed animals on that day, and 110 of those stuffed animals were teddy bears. For the shopkeeper's sample, find and write with proper notation the population proportion and sample proportion of stuffed animals that were teddy bears. Write the proportions as decimals (not percentages) rounded to two decimal places. (a) Population proportion: (Choose one) V ? (b) Sample proportion: (Choose one) ▼arrow_forward
- How is 1-1 = 1?arrow_forwardHow " P(Z>= -3.1965) " became " 1-symbol(-3.1965)"? Could you explain how you got the three last lines? Which symbol is that?arrow_forward• Consider the slope fields and the systems of the form y' = Aj, where A is given below. Match each system with its corresponding slope field by placing the number of the matrix below in the blank space provided under each slope field. Show your work to justify your answer choice in each case. 2.0- -10 4 1. A= [ 2 3 2. A = 3 2arrow_forward
arrow_back_ios
arrow_forward_ios
Recommended textbooks for you
- MATLAB: An Introduction with ApplicationsStatisticsISBN:9781119256830Author:Amos GilatPublisher:John Wiley & Sons Inc
 Probability and Statistics for Engineering and th...StatisticsISBN:9781305251809Author:Jay L. DevorePublisher:Cengage Learning
 Statistics for The Behavioral Sciences (MindTap C...StatisticsISBN:9781305504912Author:Frederick J Gravetter, Larry B. WallnauPublisher:Cengage Learning
  Elementary Statistics: Picturing the World (7th E...StatisticsISBN:9780134683416Author:Ron Larson, Betsy FarberPublisher:PEARSON
 The Basic Practice of StatisticsStatisticsISBN:9781319042578Author:David S. Moore, William I. Notz, Michael A. FlignerPublisher:W. H. Freeman
 Introduction to the Practice of StatisticsStatisticsISBN:9781319013387Author:David S. Moore, George P. McCabe, Bruce A. CraigPublisher:W. H. Freeman
MATLAB: An Introduction with Applications
Statistics
ISBN:9781119256830
Author:Amos Gilat
Publisher:John Wiley & Sons Inc
Probability and Statistics for Engineering and th...
Statistics
ISBN:9781305251809
Author:Jay L. Devore
Publisher:Cengage Learning
Statistics for The Behavioral Sciences (MindTap C...
Statistics
ISBN:9781305504912
Author:Frederick J Gravetter, Larry B. Wallnau
Publisher:Cengage Learning
Elementary Statistics: Picturing the World (7th E...
Statistics
ISBN:9780134683416
Author:Ron Larson, Betsy Farber
Publisher:PEARSON
The Basic Practice of Statistics
Statistics
ISBN:9781319042578
Author:David S. Moore, William I. Notz, Michael A. Fligner
Publisher:W. H. Freeman
Introduction to the Practice of Statistics
Statistics
ISBN:9781319013387
Author:David S. Moore, George P. McCabe, Bruce A. Craig
Publisher:W. H. Freeman