MATLAB: An Introduction with Applications
6th Edition
ISBN: 9781119256830
Author: Amos Gilat
Publisher: John Wiley & Sons Inc
expand_more
expand_more
format_list_bulleted
Concept explainers
Question

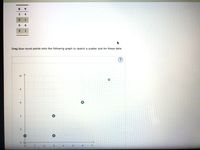
Transcribed Image Text:Y
3
4
1
6
3
Drag blue round points onto the following graph to sketch a scatter plot for these data.
10
8
6
4
7

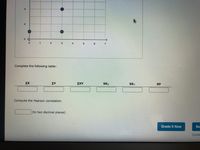
Transcribed Image Text:2
3
4
5
6
7.
Complete the following table:
ΣΧ
ΣΥ
ΣΧ
SSx
Sy
SP
Compute the Pearson correlation.
(to two decimal places)
Grade It Now
Sa
Conti
Expert Solution
This question has been solved!
Explore an expertly crafted, step-by-step solution for a thorough understanding of key concepts.
This is a popular solution
Trending nowThis is a popular solution!
Step by stepSolved in 3 steps with 5 images

Knowledge Booster
Learn more about
Need a deep-dive on the concept behind this application? Look no further. Learn more about this topic, statistics and related others by exploring similar questions and additional content below.Similar questions
- The data in the stem-and-Ileaf plot represents how far schools are from the town hall, in miles. Which statement describes the trend in the plot? Key: 3 30 = 3.30 miles Stem Leaf 08 17 29 45 69 92 1 03 34 76 81 2 13 24 3 02 78 4 40 19 83 O Schools are dispersed evenly throughout the city. O Schools are more densely packed near the town hall. O Schools are less densely packed near the town hall. O The distance between schools and the town hall follows no pattern.arrow_forwardi DO NOT have excel. simple steps please .arrow_forwardCalculate the y-intercept for the following set of data. y 0 5 TI 2 8 4 12 6 16arrow_forward
- Make a scatter plot for the given data. Use the scatter plot to describe whether or not the variables appear to be related 10 8 3 7 6 12 9 14 6 2 5 8 14 11 X Y C The variables do not appear to be related OB. The variables appear to be related Ta OC. The variables appear to be related OD. The variables appear to be relatedarrow_forwardPart Three A class of students recorded the amount of time spent on homework on Monday night. The times are recorded below, in hours. Use the data to answer questions 8 – 10. 12 3 2 2 2호 4 4 1! 1 1 4 3 3 8. Make a line plot of the data shown above. Be sure to include a title and correctly label each value. 9. Julie says the most amount of time spent on homework is 1 times the least amount of time spent on homework. Is she correct? Explain. 10. Daniel says that more than half the students spent 2- hours or more on homework. 2 Liz says more than half the students spent less than 2 hours on homework. Who is correct? Explain.arrow_forwardThe table below shows the number of state-registered automatic weapons and the murder rate for several Northwestern states. I 11.7 8 6.8 3.6 2.3 2.5 2.5 0.4 y 13.7 11 9.8 I= thousands of automatic weapons 7.4 6.2 6.2 4.2 y = murders per 100,000 residents This data can be modeled by the equation y = 0.84x + 4.11. Use this equation to answer the following; Special Note: I suggest you verify this equation by performing linear regression on your calculator. Use the equation with the values rounded to two decimal places to make your predictions. A) How many murders per 100,000 residents can be expected in a state with 8.5 thousand automatic weapons? Answer = Round to 3 decimal places. B) How many murders per 100,000 residents can be expected in a state with 2.8 thousand automatic weapons? Answer Round to 3 decimal places.arrow_forward
- Which of the following describes how the scatter plot appears? Select all that apply. S A 3 N O H 2 strong weak 3 negativearrow_forwardThe data listed below represents the number of customers entering a food store by the number of hours the store was opened on a particular day. Hours Opened Customers 0 0 2 1 4 3 6 5 8 2 10 11 12 15 Create the corresponding line graph to represent this data below.arrow_forwardThe table below shows the number of state-registered automatic weapons and the murder rate for several Northwestern states. 11.4 8.5 6.6 3.6 2.3 2.5 2.1 0.6 y 13.4 11.4 9.3 7.2 5.9 5.9 5.6 4.3 x = thousands of automatic weapons y = murders per 100,000 residents This data can be modeled by the equation y = 0.85x + 3.88. Use this equation to answer the following: Special Note: I suggest you verify this equation by performing linear regression on your calculator. A) How many murders per 100,000 residents can be expected in a state with 10 thousand automatic weapons? Round to 3 decimal places. B) How many murders per 100,000 residents can be expected in a state with 9 thousand automatic weapons? Answer = Answer= Round to 3 decimal places.arrow_forward
- L3Q2.Describe the variables in the given table using a TI calculator. x y 15 12 20 22 17 -3 A.Moderate and positive B.Weak and positive C.Weak and negative D.No correlationarrow_forwardDataset physical is available here. The figure for this exercise is a scatterplot of y 61 60 Head circumference (cm) gཆ ཆུ 56 55 54 59- 58 57 = head circumference (centimeters) versus x = height (inches) for 30 females. 53 60 62 64 66 Height (in.) 68 70 72 (a) Which association does the plot show between the two variables? Explain. There is a positive association since the average head circumference seems to decrease as height increases. There is a negative association since the average head circumference seems to increase as height increases. There is a negative association since the average head circumference seems to decrease as height increases. There is a positive association since the average head circumference seems to increase as height increases. There is no association since the average head circumference is approximately the same across heights. (b) One data point appears to be an outlier. What are the approximate values of height and head circumference for that point?…arrow_forwardThe scatter plot shows the relationship between the number of minutes studying for a test (x) and the number of mistakes made (y). The graph shows the scatterplot of the data and a fitted line. 19+ 18 17 16 15 14 13 12 10 4 -10 10 20 30 40 50 60 70 80 90 100 lio a2 Select True or False for each statement based on the scatter plot. True/False There is a negative association between the amount of time studying for a test and the number of mistakes made. True False Students who studied for a longer period of time tended to make more mistakes. True False There is a linear association between time True False studying and number of mistakes.arrow_forward
arrow_back_ios
SEE MORE QUESTIONS
arrow_forward_ios
Recommended textbooks for you
 MATLAB: An Introduction with ApplicationsStatisticsISBN:9781119256830Author:Amos GilatPublisher:John Wiley & Sons Inc
 Probability and Statistics for Engineering and th...StatisticsISBN:9781305251809Author:Jay L. DevorePublisher:Cengage Learning
 Statistics for The Behavioral Sciences (MindTap C...StatisticsISBN:9781305504912Author:Frederick J Gravetter, Larry B. WallnauPublisher:Cengage Learning
 Elementary Statistics: Picturing the World (7th E...StatisticsISBN:9780134683416Author:Ron Larson, Betsy FarberPublisher:PEARSON
 The Basic Practice of StatisticsStatisticsISBN:9781319042578Author:David S. Moore, William I. Notz, Michael A. FlignerPublisher:W. H. Freeman
 Introduction to the Practice of StatisticsStatisticsISBN:9781319013387Author:David S. Moore, George P. McCabe, Bruce A. CraigPublisher:W. H. Freeman

MATLAB: An Introduction with Applications
Statistics
ISBN:9781119256830
Author:Amos Gilat
Publisher:John Wiley & Sons Inc

Probability and Statistics for Engineering and th...
Statistics
ISBN:9781305251809
Author:Jay L. Devore
Publisher:Cengage Learning

Statistics for The Behavioral Sciences (MindTap C...
Statistics
ISBN:9781305504912
Author:Frederick J Gravetter, Larry B. Wallnau
Publisher:Cengage Learning

Elementary Statistics: Picturing the World (7th E...
Statistics
ISBN:9780134683416
Author:Ron Larson, Betsy Farber
Publisher:PEARSON

The Basic Practice of Statistics
Statistics
ISBN:9781319042578
Author:David S. Moore, William I. Notz, Michael A. Fligner
Publisher:W. H. Freeman

Introduction to the Practice of Statistics
Statistics
ISBN:9781319013387
Author:David S. Moore, George P. McCabe, Bruce A. Craig
Publisher:W. H. Freeman