Question

Transcribed Image Text:X
\CD
0
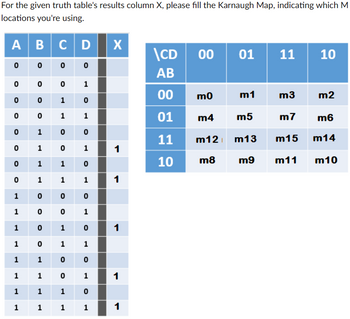
For the given truth table's results column X, please fill the Karnaugh Map, indicating which M
locations you're using.
ABCD
0 0 0
00
00
01
11
10
AB
0
0
0
1
00
m0
m1
m3
m2
0
0
1
0
0
0 1
1
01
m4
m5
m7
m6
0
1
0 0
11
m12 m13
m15
m14
0 1
0
1
1
0
1
1
0
10
m8
m9
m11
m10
0
1
1
1
1
1
0
0
0
1
0 0
1
1
0 1
0
1
1
0 1
1
1
1
0 0
1
101
1
1
1
1
0
1
1
1
1
1
Expert Solution
This question has been solved!
Explore an expertly crafted, step-by-step solution for a thorough understanding of key concepts.
Step by stepSolved in 2 steps

Knowledge Booster
Similar questions
- A University has published the CAT1, CAT 2 and FAT exam results of Winter semester. Proctor wants to visualize the attendance, number of pass, failure and grades of their proctees. Choose and describe any five appropriate plots with the corresponding R code. (e (arrow_forwardNonearrow_forwardPlease do not give solution in image format thankuarrow_forward
- Let Q(x) = "x scored 100% on the quiz". Let M(x) = "X scored 100% on the midterm". Which statement below means "Nobody scored 100% on both the quiz and the midterm"? 3x (Q(x)^-M(x)) 3x Q(x)^3x M(x) Q(x)\x-M(x) None of the other answers listed here is correct. OV (Q(x) V-M(x))arrow_forwardSlove by pythonarrow_forwardWrite a python program that return the total aquaculture production by Year, Region, and Type/Environment. You must disregard the Philippines in the region column. Use groupby to group rows according to the Year, Region, Type/Environment then apply the sum function to the Volume column to return total production per year. Create a line chart of the result that can be filtered by Type/Environment. Set the hvplot x parameter to Year and by parameter to Region, and groupby parameter to Type/Environment. Here is the dataset:arrow_forward
- Consider the following recurrence: T(1)=1; T(n) = 2.T()+n, for n> 1, n a power of 3. =..... Find T(27) by substitution, starting with n = 1, n = 65 2 169 29 15 6arrow_forwardHand trace Figure 5-20 on page 262 and produce a trace table based on this ordered input: Lot number 1 has a property value of 1000.Lot number 2 has a property value of 2000.Lot number 3 has a property value of 500.Lot 0 will end the program. No need to illustrate the Display output this time; I only want you to trace the variables. Take a snapshot of the completed trace table.arrow_forwardOCTAVE: Define e = 18 in OCTAVE. Use size to find the dimensions of a, b, and e? Find no. of rows in a and b separatearrow_forward
- BEFPULSEMIN 70 75 80 82 65 75 74 73 65 67 80 72 69 81 82 83 68 73 74 76 81 64 85 65 66 62 81 82 74 71 72 76 79 80 84 85 73 68 68 67 68 75 77 72 76 78 82 67 80 76 74 77 73 74 72 76 74 81 75 70 TATISTICSSTUDENTSSURVEYFORR contains the column BEFPULSEMIN (a numerical variable that measures student pulses before completing an online survey). For education purposes, consider this dataset to be a sample of size 60 taken from a much wider population for statistics students. Use R to find a 99% confidence interval for the mean of the population. Choose the most correct (closest) statement below. a. Your confidence interval is (72.38912, 76.41088) beats per minute and it is narrower than a 90% confidence interval created from this data. b. Your confidence interval is (72.88831, 75.91169) beats per minute and is narrower than a 90% confidence interval. c. Your…arrow_forwardFind the first two random numbers (to the fifth digit after the decimal point) using Linear Congruential Generator with a = 4, m = 11, and b = 0 and 23 as the seed. Edit View Insert Format Tools Table 12pt Paragraph BIUA !!arrow_forwardchoose the correct FOL expression for Every student who loves her teacher will also loves the course she teaches. Vx,y,z student(x)/teacher (y,×) Loves(x,y)= course(z) / teach(y,z) ^ Loves (X, 2) Vx student(x)(3y teacher (y,×)/Loves(x,y) / 3z course(z) ^ teach(y,z) ^ Loves (X,2) Vx,y,z student(x) teacher (y,×)/Loves(x,y) ^ course(2) A Loves (x,2) All of the abovearrow_forward
arrow_back_ios
arrow_forward_ios