
MATLAB: An Introduction with Applications
6th Edition
ISBN: 9781119256830
Author: Amos Gilat
Publisher: John Wiley & Sons Inc
expand_more
expand_more
format_list_bulleted
Related questions
Question

Transcribed Image Text:21:50 P
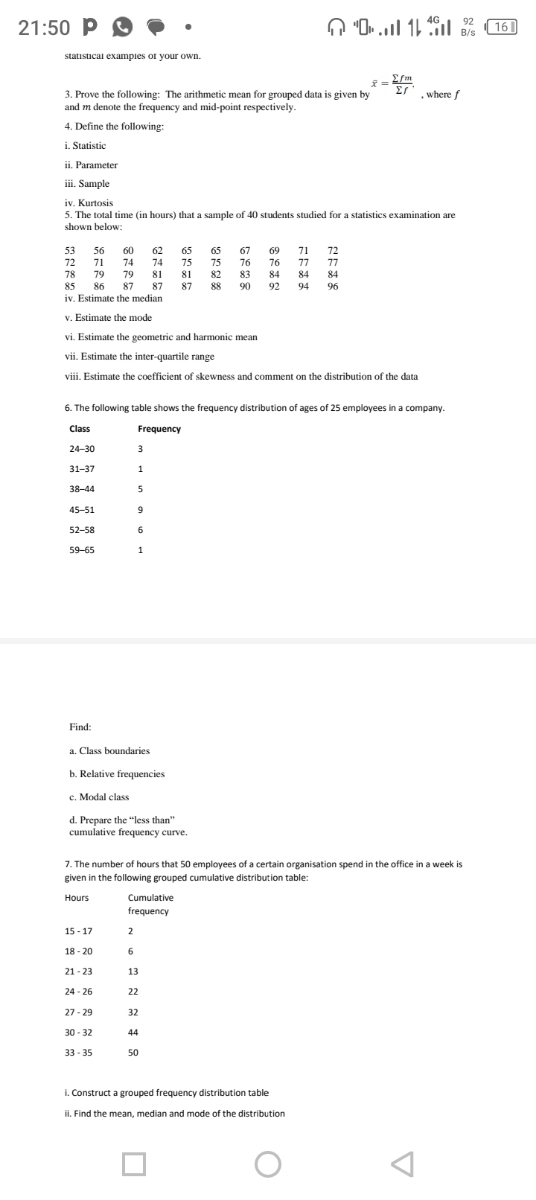
statistical examples of your own.
3. Prove the following: The arithmetic mean for grouped data is given by
and m denote the frequency and mid-point respectively.
4. Define the following:
i. Statistic
Parameter
53
72
78
ii.
iii. Sample
iv. Kurtosis
5. The total time (in hours) that a sample of 40 students studied for a statistics examination are
shown below:
56
71
24-30
31-37
38-44
45-51
52-58
59-65
Find:
60 62 65 65 67 69 71
74 74
79 81
87
79
85 86 87
iv. Estimate the median
v. Estimate the mode
vi. Estimate the geometric and harmonic mean
vii. Estimate the inter-quartile range
viii. Estimate the coefficient of skewness and comment on the distribution of the data
a. Class boundaries
b. Relative frequencies
c. Modal class
6. The following table shows the frequency distribution of ages of 25 employees in a company.
Class
Frequency
15-17
18-20
3
1
5
9
6
1
d. Prepare the "less than"
cumulative frequency curve.
21-23
24-26
27-29
30-32
33-35
Cumulative
frequency
2
6
13
75
81
87
22
32
75
82
7. The number of hours that 50 employees of a certain organisation spend in the office in a week is
given in the following grouped cumulative distribution table:
Hours
44
76
83
90
50
72
76 77 77
84
84
84
92 94 96
18 161
Σfm
x = 2m
27
i. Construct a grouped frequency distribution table
ii. Find the mean, median and mode of the distribution
, where f
O
92
Expert Solution
This question has been solved!
Explore an expertly crafted, step-by-step solution for a thorough understanding of key concepts.

Step by stepSolved in 3 steps with 1 images

Knowledge Booster

Similar questions
- The accompanying data table contains the prices and weights of the diamonds in 10 rings offered for sale. The prices are 4 carats an Xough d belo Data (Daund both The weight in carats and price in dollars for 10 diamond rings Weight 0.29 0.32 0.34 0.17 0.36 0.36 0.12 0.14 0.23 0.26 Price 924 881 1,039 445 1,073 1,034 120 320 665 733 Print Done - rings. ble.arrow_forward3:34 İ. Construct a simple frequency distribution for grouped data; display your findings in a table (number of intervals should be 5) ii. Add a column to your table with the cumulative frequency (bottom up). iii. Add a column to your table with the relative frequency. iv. Add a column to your table with the relative percent. v. Add a column to your table with the cumulative percent. vi. Construct a histogram that distributes the intervals along the horizontal scale (x-axis) and list the frequency of scores in each interval on the vertical scale vii. Construct an Ogive for this data. Grade 95 94 65 77 69 45 54 88 75 39 15 56 63 93 84 70 63 52 79 81 87 69 99 48 65 83 44 5G 91 35 57 60arrow_forwardMake a frequency distribution for the data. X f 1 2 2 20 3 21 4 15 The sample mean is x = (Round to one decimal place as needed.)arrow_forward
arrow_back_ios
arrow_forward_ios
Recommended textbooks for you
- MATLAB: An Introduction with ApplicationsStatisticsISBN:9781119256830Author:Amos GilatPublisher:John Wiley & Sons Inc
 Probability and Statistics for Engineering and th...StatisticsISBN:9781305251809Author:Jay L. DevorePublisher:Cengage Learning
 Statistics for The Behavioral Sciences (MindTap C...StatisticsISBN:9781305504912Author:Frederick J Gravetter, Larry B. WallnauPublisher:Cengage Learning
  Elementary Statistics: Picturing the World (7th E...StatisticsISBN:9780134683416Author:Ron Larson, Betsy FarberPublisher:PEARSON
 The Basic Practice of StatisticsStatisticsISBN:9781319042578Author:David S. Moore, William I. Notz, Michael A. FlignerPublisher:W. H. Freeman
 Introduction to the Practice of StatisticsStatisticsISBN:9781319013387Author:David S. Moore, George P. McCabe, Bruce A. CraigPublisher:W. H. Freeman
MATLAB: An Introduction with Applications
Statistics
ISBN:9781119256830
Author:Amos Gilat
Publisher:John Wiley & Sons Inc
Probability and Statistics for Engineering and th...
Statistics
ISBN:9781305251809
Author:Jay L. Devore
Publisher:Cengage Learning
Statistics for The Behavioral Sciences (MindTap C...
Statistics
ISBN:9781305504912
Author:Frederick J Gravetter, Larry B. Wallnau
Publisher:Cengage Learning
Elementary Statistics: Picturing the World (7th E...
Statistics
ISBN:9780134683416
Author:Ron Larson, Betsy Farber
Publisher:PEARSON
The Basic Practice of Statistics
Statistics
ISBN:9781319042578
Author:David S. Moore, William I. Notz, Michael A. Fligner
Publisher:W. H. Freeman
Introduction to the Practice of Statistics
Statistics
ISBN:9781319013387
Author:David S. Moore, George P. McCabe, Bruce A. Craig
Publisher:W. H. Freeman