MATLAB: An Introduction with Applications
6th Edition
ISBN: 9781119256830
Author: Amos Gilat
Publisher: John Wiley & Sons Inc
expand_more
expand_more
format_list_bulleted
Question
thumb_up100%

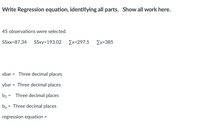
Transcribed Image Text:Write Regression equation, identifying all parts. Show all work here.
45 observations were selected.
SSxx=87.34 SSxy=193.02 Ex=297.5 Zy=385
xbar = Three decimal places
ybar = Three decimal places
b1 = Three decimal places
bo = Three decimal places
regression equation =
Expert Solution
This question has been solved!
Explore an expertly crafted, step-by-step solution for a thorough understanding of key concepts.
Step by stepSolved in 2 steps with 2 images

Knowledge Booster
Similar questions
- A regression was run to determine if there is a relationship between hours of study per week (z) and the test scores (y)- The results of the regression were: y=ax+b a=5.701 b=31.89 r2=0.660969 r=0.813 Use this to predict the final exam score of a student who studies 3.5 hours per week, and please round your answer to a whole number. Question Help: Message instructor Submit Question rse here to search Rarrow_forwardA regression was run to determine if there is a relationship between hours of study per week (x) and the final exam scores (y).The results of the regression were: y=ax+b a=5.088 b=26.56 r2=0.913936 r=0.956 Use this to predict the final exam score of a student who studies 4.5 hours per week, and please round your answer to a whole number.arrow_forwardA regression was run to determine if there is a relationship between hours of study per week (X) and the test scores (y ). The results of the regression were:y=ax+ba=5.931b=20.1r2=0.748225r=0.865Use this to predict the final exam score of a student who studies 3 hours per week, and please round your answer to a whole number.arrow_forward
- The data provided give the number of standby hours based on total staff present, X₁, and remote hours, X₂. Perform a multiple regression analysis using the data provided and determine the VIF for each independent variable in the model. Is there reason to suspect the existence of collinearity? Click the icon to view the data. Determine the VIF for each independent variable in the model. | VIF ₂2 = VIF₁ = (Round to three decimal places as needed.) Is there reason to suspect the existence of collinearity? OA. No. The VIF for each independent variable is less than 5. B. Yes. The VIF for each independent variable is greater than 5. OC. No. The VIF for each independent variable is greater than 5. OD. Yes. The VIF for each independent variable is less than 5. wwwwwww Table of Data Standby Total Staff Hours Present 245 330 274 358 195 197 117 153 115 275 200 236 336 339 321 303 286 329 352 323 Remote Hours 417 655 524 385 349 350 388 153 278 479 Print Donearrow_forwardI need in one hour pls help thankyouarrow_forwardWrite down the two regression equation.arrow_forward
- Use StatKey or other technology to find the regression line to predict Y from X using the following data. Click here to access StatKey. Round your answers to three decimal places. ^ The regression equation is Y = i X 3 Y 1.5 5 2 7 6 3 + i 1 5.5 3.5 X.arrow_forwardA regression was run to determine if there is a relationship between hours of TV watched per day (x) and number of situps a person can do (y). The results of the regression were: y=ax+b a=-0.889 b=31.442 r²=0.3721 r=-0.61 Use this to predict the number of situps a person who watches 4 hours of TV can do (to one decimal place)arrow_forwardPlease do only the last threearrow_forward
- Please answer this questions I need help from expert. I will give likes to your answer answr in 10 minutes. Thanks. Don't copy from any websitesarrow_forwardA regression was run to determine if there is a relationship between hours of TV watched per day (xx) and number of situps a person can do (yy). The results of the regression were: y=ax+ba=-1.392b=32.952r2=0.527076r=-0.726Use this to predict the number of situps a person who watches 2 hour(s) of TV can do, and please round your answer to a whole number.arrow_forwardThe regression equation between two variables X and y is Y =1.6+2.2 X Find the predicted Y value for X =13?arrow_forward
arrow_back_ios
SEE MORE QUESTIONS
arrow_forward_ios
Recommended textbooks for you
 MATLAB: An Introduction with ApplicationsStatisticsISBN:9781119256830Author:Amos GilatPublisher:John Wiley & Sons Inc
 Probability and Statistics for Engineering and th...StatisticsISBN:9781305251809Author:Jay L. DevorePublisher:Cengage Learning
 Statistics for The Behavioral Sciences (MindTap C...StatisticsISBN:9781305504912Author:Frederick J Gravetter, Larry B. WallnauPublisher:Cengage Learning
 Elementary Statistics: Picturing the World (7th E...StatisticsISBN:9780134683416Author:Ron Larson, Betsy FarberPublisher:PEARSON
 The Basic Practice of StatisticsStatisticsISBN:9781319042578Author:David S. Moore, William I. Notz, Michael A. FlignerPublisher:W. H. Freeman
 Introduction to the Practice of StatisticsStatisticsISBN:9781319013387Author:David S. Moore, George P. McCabe, Bruce A. CraigPublisher:W. H. Freeman

MATLAB: An Introduction with Applications
Statistics
ISBN:9781119256830
Author:Amos Gilat
Publisher:John Wiley & Sons Inc

Probability and Statistics for Engineering and th...
Statistics
ISBN:9781305251809
Author:Jay L. Devore
Publisher:Cengage Learning

Statistics for The Behavioral Sciences (MindTap C...
Statistics
ISBN:9781305504912
Author:Frederick J Gravetter, Larry B. Wallnau
Publisher:Cengage Learning

Elementary Statistics: Picturing the World (7th E...
Statistics
ISBN:9780134683416
Author:Ron Larson, Betsy Farber
Publisher:PEARSON

The Basic Practice of Statistics
Statistics
ISBN:9781319042578
Author:David S. Moore, William I. Notz, Michael A. Fligner
Publisher:W. H. Freeman

Introduction to the Practice of Statistics
Statistics
ISBN:9781319013387
Author:David S. Moore, George P. McCabe, Bruce A. Craig
Publisher:W. H. Freeman