Advanced Engineering Mathematics
10th Edition
ISBN: 9780470458365
Author: Erwin Kreyszig
Publisher: Wiley, John & Sons, Incorporated
expand_more
expand_more
format_list_bulleted
Question
Answer e and f only please

Transcribed Image Text:1
3
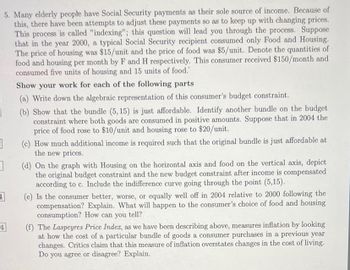
5. Many elderly people have Social Security payments as their sole source of income. Because of
this, there have been attempts to adjust these payments so as to keep up with changing prices.
This process is called "indexing"; this question will lead you through the process. Suppose
that in the year 2000, a typical Social Security recipient consumed only Food and Housing.
The price of housing was $15/unit and the price of food was $5/unit. Denote the quantities of
food and housing per month by F and H respectively. This consumer received $150/month and
consumed five units of housing and 15 units of food."
1
4
Show your work for each of the following parts
(a) Write down the algebraic representation of this consumer's budget constraint.
(b) Show that the bundle (5, 15) is just affordable. Identify another bundle on the budget.
constraint where both goods are consumed in positive amounts. Suppose that in 2004 the
price of food rose to $10/unit and housing rose to $20/unit.
(c) How much additional income is required such that the original bundle is just affordable at
the new prices.
(d) On the graph with Housing on the horizontal axis and food on the vertical axis, depict
the original budget constraint and the new budget constraint after income is compensated
according to c. Include the indifference curve going through the point (5,15).
(e) Is the consumer better, worse, or equally well off in 2004 relative to 2000 following the
compensation? Explain. What will happen to the consumer's choice of food and housing
consumption? How can you tell?
(f) The Laspeyres Price Index, as we have been describing above, measures inflation by looking
at how the cost of a particular bundle of goods a consumer purchases in a previous year
changes. Critics claim that this measure of inflation overstates changes in the cost of living.
Do you agree or disagree? Explain.
Expert Solution
This question has been solved!
Explore an expertly crafted, step-by-step solution for a thorough understanding of key concepts.
Step by stepSolved in 2 steps

Knowledge Booster
Similar questions
Recommended textbooks for you
 Advanced Engineering MathematicsAdvanced MathISBN:9780470458365Author:Erwin KreyszigPublisher:Wiley, John & Sons, Incorporated
 Numerical Methods for EngineersAdvanced MathISBN:9780073397924Author:Steven C. Chapra Dr., Raymond P. CanalePublisher:McGraw-Hill Education
 Introductory Mathematics for Engineering Applicat...Advanced MathISBN:9781118141809Author:Nathan KlingbeilPublisher:WILEY
 Mathematics For Machine TechnologyAdvanced MathISBN:9781337798310Author:Peterson, John.Publisher:Cengage Learning,


Advanced Engineering Mathematics
Advanced Math
ISBN:9780470458365
Author:Erwin Kreyszig
Publisher:Wiley, John & Sons, Incorporated

Numerical Methods for Engineers
Advanced Math
ISBN:9780073397924
Author:Steven C. Chapra Dr., Raymond P. Canale
Publisher:McGraw-Hill Education

Introductory Mathematics for Engineering Applicat...
Advanced Math
ISBN:9781118141809
Author:Nathan Klingbeil
Publisher:WILEY

Mathematics For Machine Technology
Advanced Math
ISBN:9781337798310
Author:Peterson, John.
Publisher:Cengage Learning,

