Advanced Engineering Mathematics
10th Edition
ISBN: 9780470458365
Author: Erwin Kreyszig
Publisher: Wiley, John & Sons, Incorporated
expand_more
expand_more
format_list_bulleted
Question

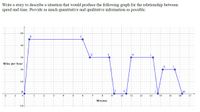
Transcribed Image Text:Write a story to describe a situation that would produce the following graph for the relationship between
speed and time. Provide as much quantitative and qualitative information as possible.
50
B
C
40
D
E
H.
30
Miles per hour
K
20
10
A
G
-2
-1
1
3
4
5
7
8
9
10
11
12
13
14
15
16
17
Minutes
-10
Expert Solution
This question has been solved!
Explore an expertly crafted, step-by-step solution for a thorough understanding of key concepts.
Step by stepSolved in 3 steps

Knowledge Booster
Similar questions
- Use the example to help answer.arrow_forwardPlease help!arrow_forwardO Fresentetian Session Student IL s Add-ons Help Last edit was 23 minutes ago Background Layout- Theme Transition 3 4 6 7 Ir8 L 9 l 3. A bicycle rental place charges $5 per hour to rent a bicycle plus a $10 rental fee. Which graph best represents the relationship between y, the total cost of rental and x, the number of hours rented? B. C. 70 1234 Se Time (hours) Time (hours) 567 8 9 10 123 Time (hours) Answer: (Sepop) 1so0arrow_forward
- How much should a healthy Shetland pony weigh? Let x be the age of the pony (in months), and let y be the average weight of the pony (in kilograms). x 3 6 12 15 21 y 60 95 140 172 173 (a) Make a scatter diagram of the data and visualize the line you think best fits the data. A scatter diagram has a horizontal axis labeled "x (age (in months))" with values from 60 to 173 and a vertical axis labeled "y (average weight (in kg))" with values from 3 to 21. The scatter diagram has 5 points. A pattern goes up and right from (60, 3) to (173, 21). A scatter diagram has a horizontal axis labeled "x (age (in months))" with values from 3 to 21 and a vertical axis labeled "y (average weight (in kg))" with values from 60 to 173. The scatter diagram has 5 points. A pattern goes down and right from (3, 173) to (21, 60). A scatter diagram has a horizontal axis labeled "x (age (in months))" with values from 3 to 21 and a vertical axis labeled "y (average weight (in kg))" with…arrow_forward2.An object whose temperature is 100°C is placed in a medium whose temperature is A°C. The temperature of the object falls to B°C in C min. a) Express the temperature T of the object as a function of time and draw its graph roughly to the scale. b)Calculate how long will it take the object to cool to 50°C. See table below to find "your" numerical values. A 25 30 35 R 0 1 2 B 80 75 70 C 10 15 20arrow_forwardThis data describes the flight of a plastic glider launched from a tower on a hilltop. The height values are negative whenever the glider was below the height of the hilltop. Find the lowest point in the gliders path. TIME (s) HEIGHT (m) 0 9 1 5.5 2 2.5 3 0 4 -2 5 -3.5 6 -4.5 7 -5 8 -5 9 -4.5 10 -3.5 11 -2 12 0 13 2.5 14 5.5 15 9 16 13 17 17.5 18 22.5 19 28 20 34arrow_forward
arrow_back_ios
arrow_forward_ios
Recommended textbooks for you
 Advanced Engineering MathematicsAdvanced MathISBN:9780470458365Author:Erwin KreyszigPublisher:Wiley, John & Sons, Incorporated
 Numerical Methods for EngineersAdvanced MathISBN:9780073397924Author:Steven C. Chapra Dr., Raymond P. CanalePublisher:McGraw-Hill Education
 Introductory Mathematics for Engineering Applicat...Advanced MathISBN:9781118141809Author:Nathan KlingbeilPublisher:WILEY
 Mathematics For Machine TechnologyAdvanced MathISBN:9781337798310Author:Peterson, John.Publisher:Cengage Learning,


Advanced Engineering Mathematics
Advanced Math
ISBN:9780470458365
Author:Erwin Kreyszig
Publisher:Wiley, John & Sons, Incorporated

Numerical Methods for Engineers
Advanced Math
ISBN:9780073397924
Author:Steven C. Chapra Dr., Raymond P. Canale
Publisher:McGraw-Hill Education

Introductory Mathematics for Engineering Applicat...
Advanced Math
ISBN:9781118141809
Author:Nathan Klingbeil
Publisher:WILEY

Mathematics For Machine Technology
Advanced Math
ISBN:9781337798310
Author:Peterson, John.
Publisher:Cengage Learning,

