
MATLAB: An Introduction with Applications
6th Edition
ISBN: 9781119256830
Author: Amos Gilat
Publisher: John Wiley & Sons Inc
expand_more
expand_more
format_list_bulleted
Related questions
Question
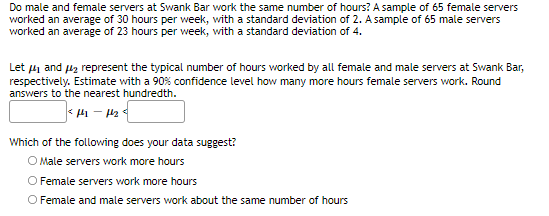

Transcribed Image Text:Do male and female servers at Swank Bar work the same number of hours? A sample of 65 female servers
worked an average of 30 hours per week, with a standard deviation of 2. A sample of 65 male servers
worked an average of 23 hours per week, with a standard deviation of 4.
Let 41 and uz represent the typical number of hours worked by all female and male servers at Swank Bar,
respectively. Estimate with a 90% confidence level how many more hours female servers work. Round
answers to the nearest hundredth.
Which of the following does your data suggest?
O Male servers work more hours
O Female servers work more hours
O Female and male servers work about the same number of hours
Expert Solution
This question has been solved!
Explore an expertly crafted, step-by-step solution for a thorough understanding of key concepts.

This is a popular solution

Trending nowThis is a popular solution!

Step by stepSolved in 2 steps

Knowledge Booster

Similar questions
- For the purposes of constructing modified bo plots. ou ers are defined as data values that are above Q3 by an amount greater than 1.5xiaR ○ beo Q1 by an amount greater than 1.5xIQR, where IQR is the interquartile range. Using this definition of outliers, find the probability that when a value is randomly selected from a normal distribution, it is an outlier. The probability that a randomly selected value taken from a normal distribution is considered an outlier is Round to four decimal places as needed.)arrow_forwardA medical doctor is interested in determining whether mean body temperatures are different in the morning and at night. Five patients were recruited and their body temperatures were measured first at 8 AM and then again at 10 PM. The data is in the following table: Patient 1 2 4 Morning Night 98.0 97.6 97.2 97.0 98.0 97.0 98.8 97.6 97.7 98.8 For this matched pairs experiment, you should take the differences by calculating: Morning - Night. Also, you may use the fact that the sample standard deviation of 44/V5 the differences is 0.844 and that 0.844 0.3774. What is the test statistic for the test? Round your final answer to two decimals. Next Page Page 5 of 15 126 53 1. NOV 18arrow_forwardsolve a and barrow_forward
- Do question 3arrow_forwardI’ve already posted this one, but I’m posting it again, because I need to be shown what to input into my TI-84 Plus calculator to solve.arrow_forwardWe would like to create a confidence interval for the mean. Which of the following would produce the smallest margin of error? Select one: a.A 95% confidence level and a sample size of 150 subjects b. A 99% confidence level and a sample size of 600 subjects. c. A 99% confidence level and a sample size of 150 subjects. d.A 95% confidence level and a sample size of 600 subjects.arrow_forward
- Find the standard deviation.. Round to one more place than the data 7,19,20,8,17, 14, 8, 20, 12 O A. 5.1 O B. 1.7 O C. 5.4 O D. 5.7arrow_forwardA medical doctor is interested in determining whether mean body temperatures are different in the morning and at night. Five patients were recruited and their body temperatures were measured first at 8 AM and then again at 10 PM. The data is in the following table: Patient 1 3 14 5 Morning 98.0 97.6 97.2 97.0 98.0 Night 97.0 98.8 97.6 97.7 98.8 For this matched pairs experiment, you should take the differences by calculating: Morning Night. What is the alternative hypothesis of interest? OH1 : HD 0 O H1 : µp # 0 Next Page Page 4 of 15 126 NOV 18 MacBook Proarrow_forward
arrow_back_ios
arrow_forward_ios
Recommended textbooks for you
- MATLAB: An Introduction with ApplicationsStatisticsISBN:9781119256830Author:Amos GilatPublisher:John Wiley & Sons Inc
 Probability and Statistics for Engineering and th...StatisticsISBN:9781305251809Author:Jay L. DevorePublisher:Cengage Learning
 Statistics for The Behavioral Sciences (MindTap C...StatisticsISBN:9781305504912Author:Frederick J Gravetter, Larry B. WallnauPublisher:Cengage Learning
  Elementary Statistics: Picturing the World (7th E...StatisticsISBN:9780134683416Author:Ron Larson, Betsy FarberPublisher:PEARSON
 The Basic Practice of StatisticsStatisticsISBN:9781319042578Author:David S. Moore, William I. Notz, Michael A. FlignerPublisher:W. H. Freeman
 Introduction to the Practice of StatisticsStatisticsISBN:9781319013387Author:David S. Moore, George P. McCabe, Bruce A. CraigPublisher:W. H. Freeman
MATLAB: An Introduction with Applications
Statistics
ISBN:9781119256830
Author:Amos Gilat
Publisher:John Wiley & Sons Inc
Probability and Statistics for Engineering and th...
Statistics
ISBN:9781305251809
Author:Jay L. Devore
Publisher:Cengage Learning
Statistics for The Behavioral Sciences (MindTap C...
Statistics
ISBN:9781305504912
Author:Frederick J Gravetter, Larry B. Wallnau
Publisher:Cengage Learning
Elementary Statistics: Picturing the World (7th E...
Statistics
ISBN:9780134683416
Author:Ron Larson, Betsy Farber
Publisher:PEARSON
The Basic Practice of Statistics
Statistics
ISBN:9781319042578
Author:David S. Moore, William I. Notz, Michael A. Fligner
Publisher:W. H. Freeman
Introduction to the Practice of Statistics
Statistics
ISBN:9781319013387
Author:David S. Moore, George P. McCabe, Bruce A. Craig
Publisher:W. H. Freeman