
MATLAB: An Introduction with Applications
6th Edition
ISBN: 9781119256830
Author: Amos Gilat
Publisher: John Wiley & Sons Inc
expand_more
expand_more
format_list_bulleted
Related questions
Question
Need help with a review statistics question ASAP
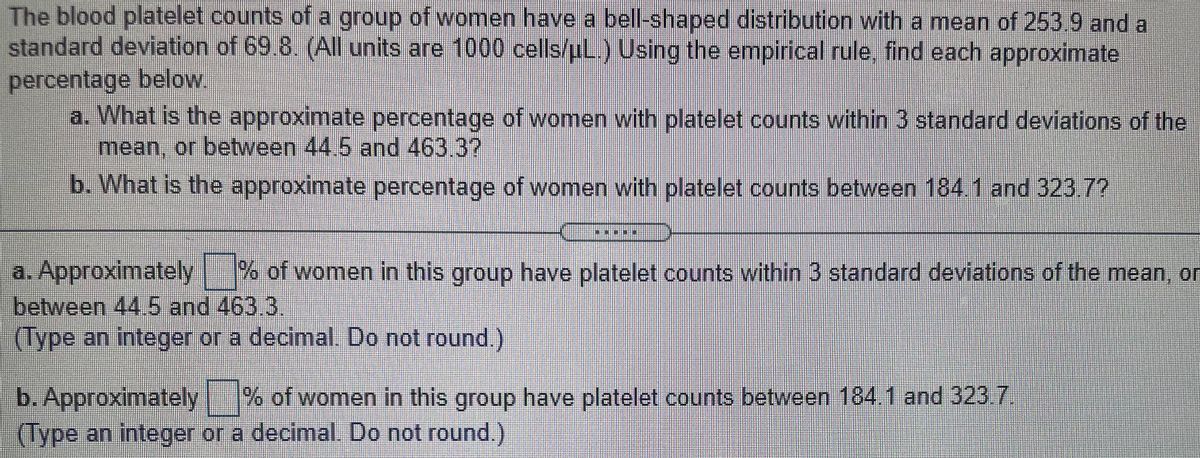

Transcribed Image Text:The blood platelet counts of a group of women have a bell-shaped distribution with a mean of 253.9 and a
standard deviation of 69.8. (AIl units are 1000 cells/uL.) Using the empirical rule, find each approximate
percentage below
a. What is the approximate percentage of women with platelet counts within 3 standard deviations of the
mean, or between 44.5 and 463.37
b. What is the approximate percentage of women with platelet counts between 184 1 and 323 7?
a. Approximately
between 44.5 and 463.3,
(Type an integer or a decimal. Do not round)
%% of women in this group have platelet counts within 3 standard deviations of the mean, or
b. Approximately % of women in this group have platelet counts between 184 1 and 323 7
(Type an integer or a decimal. Do not round.)
.
Expert Solution
This question has been solved!
Explore an expertly crafted, step-by-step solution for a thorough understanding of key concepts.

This is a popular solution

Trending nowThis is a popular solution!

Step by stepSolved in 2 steps with 1 images

Knowledge Booster

Similar questions
- Based on the tables can you write an in-depth summary for each? Thank you. Descriptive statistics of Sample Characteristics, Drug Use and Mental Health Bivariable Analyses Multivariable Analyses In this study we assess lifetime and recent drug use patterns among 261 heterosexually identified 18- to 25-year-olds through brief street intercept surveys conducted in New York City. Marijuana, hallucinogens, powder cocaine, and ecstasy were the most frequently reported drugs for both lifetime and recent use. Findings further suggest significant differences in lifetime use along the lines of gender, race=ethnicity, and school enrollment for various drugs. Males reported using significantly greater numbers of different drugs compared to females, as did those not enrolled in school compared to school enrollees. These data suggest that illicit drug use in emergent adulthood does not develop in a monolithic manner and synergies must be considered in relation to gender, school enrollment, and…arrow_forwardWhat are the two main branches of statistics? The two main branches of statistics are qualitative statistics and quantitative statistics. descriptive statistics and inferential statistics. sample statistics and parameter statistics. sample statistics and population statistics.arrow_forwardAnswer each question fully. Use a minimum of 250 words for a complete discussion post. While it is not required in this discussion, feel free to bring in outside resources to support your answers. Outside resources include materials outside of the textbook, such as a website. An average is an attempt to summarize a collection of data into just one number. 1) Explain how the mean, median, and mode all represent averages in this context.2) Why is the mean a balance point? Why is the median a midway point? Why is the mode the most common data point?3) List three areas of daily life in which you think the mean, median, or mode would be the best choice to describe an “average and explain why.arrow_forward
- What is the easiest way to learn to remember the definitions Statistics Sample population Data perimeterarrow_forwardIn a recent article you see a histogram graph that displayed the average number of hours teens get in a night. The graph is a form of what type of statistics? Descriptive or Inferentialarrow_forwardA statistic is a measure that describes a population characteristic.arrow_forward
arrow_back_ios
arrow_forward_ios
Recommended textbooks for you
- MATLAB: An Introduction with ApplicationsStatisticsISBN:9781119256830Author:Amos GilatPublisher:John Wiley & Sons Inc
 Probability and Statistics for Engineering and th...StatisticsISBN:9781305251809Author:Jay L. DevorePublisher:Cengage Learning
 Statistics for The Behavioral Sciences (MindTap C...StatisticsISBN:9781305504912Author:Frederick J Gravetter, Larry B. WallnauPublisher:Cengage Learning
  Elementary Statistics: Picturing the World (7th E...StatisticsISBN:9780134683416Author:Ron Larson, Betsy FarberPublisher:PEARSON
 The Basic Practice of StatisticsStatisticsISBN:9781319042578Author:David S. Moore, William I. Notz, Michael A. FlignerPublisher:W. H. Freeman
 Introduction to the Practice of StatisticsStatisticsISBN:9781319013387Author:David S. Moore, George P. McCabe, Bruce A. CraigPublisher:W. H. Freeman
MATLAB: An Introduction with Applications
Statistics
ISBN:9781119256830
Author:Amos Gilat
Publisher:John Wiley & Sons Inc
Probability and Statistics for Engineering and th...
Statistics
ISBN:9781305251809
Author:Jay L. Devore
Publisher:Cengage Learning
Statistics for The Behavioral Sciences (MindTap C...
Statistics
ISBN:9781305504912
Author:Frederick J Gravetter, Larry B. Wallnau
Publisher:Cengage Learning
Elementary Statistics: Picturing the World (7th E...
Statistics
ISBN:9780134683416
Author:Ron Larson, Betsy Farber
Publisher:PEARSON
The Basic Practice of Statistics
Statistics
ISBN:9781319042578
Author:David S. Moore, William I. Notz, Michael A. Fligner
Publisher:W. H. Freeman
Introduction to the Practice of Statistics
Statistics
ISBN:9781319013387
Author:David S. Moore, George P. McCabe, Bruce A. Craig
Publisher:W. H. Freeman