
A First Course in Probability (10th Edition)
10th Edition
ISBN: 9780134753119
Author: Sheldon Ross
Publisher: PEARSON
expand_more
expand_more
format_list_bulleted
Related questions
Question
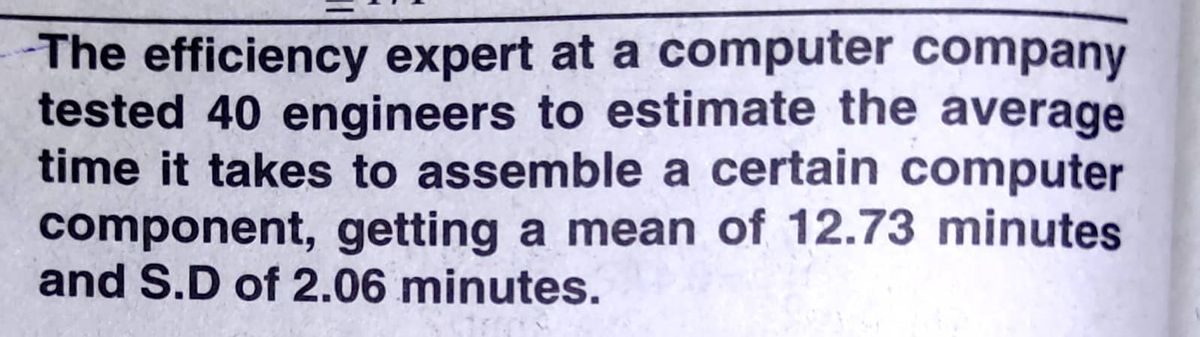

Transcribed Image Text:The efficiency expert at a computer company
tested 40 engineers to estimate the average
time it takes to assemble a certain computer
component, getting a mean of 12.73 minutes
and S.D of 2.06 minutes.

Transcribed Image Text:(iii) With what confidence can we assert that
the sample mean does not differ from the
true mean by more than 30 seconds.
Expert Solution
This question has been solved!
Explore an expertly crafted, step-by-step solution for a thorough understanding of key concepts.

This is a popular solution

Trending nowThis is a popular solution!

Step by stepSolved in 2 steps with 2 images

Knowledge Booster

Similar questions
- What is the relationship between the mean of a population and the mean of its sampling distribution?arrow_forwardThe distribution of sample means will always be normal if taken from a normal population. True or False?arrow_forwardA research scientist wishes to test the claim that the mean number of children per classroom in California elementary school is less than 35. She selects a simple random sample of 29 California elementary school classrooms. She know nothing about the distribution of children in classrooms. Can she use the data to test her claim?arrow_forward
- It is widely claimed that a histogram is skewed to the left when the median is greater than the mean and to the right when the median is less than the mean. But there are exceptions to this claim. Demonstrate this exception by creating a data set that has at least 15 samples and plot the histogram.arrow_forwardPlease also explain why you determined whether or not the results are statistically significant. In another memory experiment, the mean scores for participants in Condition A and Condition B came out exactly the same!arrow_forwardOn average, a sample of n = 36 scores will provide a better estimate of the population mean than a sample of n = 49 scores from the same population.arrow_forward
- There are many ways to measure the reading ability of children. One frequently used test is the DRP or Degree of Reading Power. The national average score in DRP test is 32. We want to determine if there is sufficient evidence at the 5% level to suggest that the mean score of all third graders in YOUR district is higher than the national mean. The DRP scores for a simple random sample of 41 third graders in that suburban school in YOUR district yielded a mean of 35.2. Assume that the population of DRP scores of third graders in that suburban school district are normally distributed with a population std.dev of 11.arrow_forwardWhen an observation that is much larger than the rest of the data is added to a data set the value of the median will increase substantially . True or False?arrow_forward
arrow_back_ios
arrow_forward_ios
Recommended textbooks for you
- A First Course in Probability (10th Edition)ProbabilityISBN:9780134753119Author:Sheldon RossPublisher:PEARSON

A First Course in Probability (10th Edition)
Probability
ISBN:9780134753119
Author:Sheldon Ross
Publisher:PEARSON