
ENGR.ECONOMIC ANALYSIS
14th Edition
ISBN: 9780190931919
Author: NEWNAN
Publisher: Oxford University Press
expand_more
expand_more
format_list_bulleted
Related questions
Question
thumb_up100%
Please help

Transcribed Image Text:**Transcription for Educational Website**
---
**Understanding Economic Policy in Relation to Aggregate Demand: Analyzing the Graph**
**Graph Explanation:**
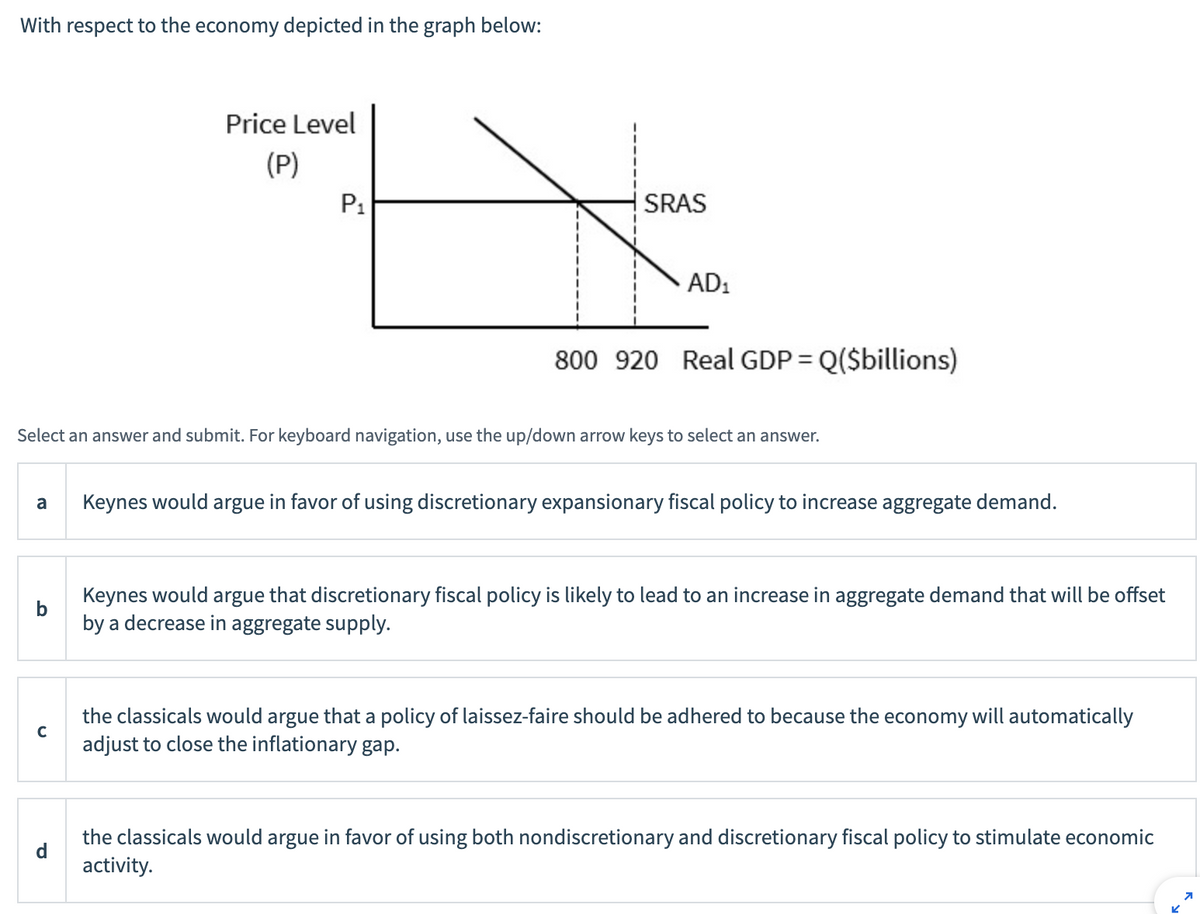
The graph illustrates the relationship between Price Level (P) and Real GDP (Q in billions of dollars). The key lines depicted are:
- **SRAS (Short-Run Aggregate Supply):** This upward-sloping line represents the total quantity of goods and services that producers in an economy are willing to supply at each price level in the short run.
- **AD₁ (Aggregate Demand):** This downward-sloping line shows the total quantity of goods and services demanded across all levels of the economy at different price levels.
- The initial price level is marked as **P₁**, with the real GDP level depicted at 800 billion dollars, extending to a potential output level of 920 billion dollars. This suggests a possible output gap.
**Question:**
With respect to the economy depicted in the graph, select an answer based on economic theories regarding fiscal policy:
**Answer Choices:**
a. Keynes would argue in favor of using discretionary expansionary fiscal policy to increase aggregate demand.
b. Keynes would argue that discretionary fiscal policy is likely to lead to an increase in aggregate demand that will be offset by a decrease in aggregate supply.
c. The classicals would argue that a policy of laissez-faire should be adhered to because the economy will automatically adjust to close the inflationary gap.
d. The classicals would argue in favor of using both nondiscretionary and discretionary fiscal policy to stimulate economic activity.
---
Select an answer and submit. For keyboard navigation, use the up/down arrow keys to select an answer.
Expert Solution
arrow_forward
Step 1
Here, in the given graph, it can be seen that short-run equilibrium real output is $800 with the price of P1, while potential output is $920.

Step by stepSolved in 2 steps

Knowledge Booster


Learn more about
Need a deep-dive on the concept behind this application? Look no further. Learn more about this topic, economics and related others by exploring similar questions and additional content below.Similar questions
arrow_back_ios
arrow_forward_ios
Recommended textbooks for you
 Principles of Economics (12th Edition)EconomicsISBN:9780134078779Author:Karl E. Case, Ray C. Fair, Sharon E. OsterPublisher:PEARSON
 Engineering Economy (17th Edition)EconomicsISBN:9780134870069Author:William G. Sullivan, Elin M. Wicks, C. Patrick KoellingPublisher:PEARSON
 Principles of Economics (MindTap Course List)EconomicsISBN:9781305585126Author:N. Gregory MankiwPublisher:Cengage Learning
 Managerial Economics: A Problem Solving ApproachEconomicsISBN:9781337106665Author:Luke M. Froeb, Brian T. McCann, Michael R. Ward, Mike ShorPublisher:Cengage Learning
 Managerial Economics & Business Strategy (Mcgraw-...EconomicsISBN:9781259290619Author:Michael Baye, Jeff PrincePublisher:McGraw-Hill Education
Principles of Economics (12th Edition)
Economics
ISBN:9780134078779
Author:Karl E. Case, Ray C. Fair, Sharon E. Oster
Publisher:PEARSON
Engineering Economy (17th Edition)
Economics
ISBN:9780134870069
Author:William G. Sullivan, Elin M. Wicks, C. Patrick Koelling
Publisher:PEARSON
Principles of Economics (MindTap Course List)
Economics
ISBN:9781305585126
Author:N. Gregory Mankiw
Publisher:Cengage Learning
Managerial Economics: A Problem Solving Approach
Economics
ISBN:9781337106665
Author:Luke M. Froeb, Brian T. McCann, Michael R. Ward, Mike Shor
Publisher:Cengage Learning
Managerial Economics & Business Strategy (Mcgraw-...
Economics
ISBN:9781259290619
Author:Michael Baye, Jeff Prince
Publisher:McGraw-Hill Education