
A First Course in Probability (10th Edition)
10th Edition
ISBN: 9780134753119
Author: Sheldon Ross
Publisher: PEARSON
expand_more
expand_more
format_list_bulleted
Related questions
Question
thumb_up100%
I need help with this please

Transcribed Image Text:Areas under the Normal Curve
=
.00
.02
.03
.01
.04
.05
.06 .07 .08
.09
%
-3.4 0.0003 0.0003 0.0003 0.0003 0.0003 0.0003 0.0003 0.0003 0.0003 0.0002 -3.4
-3.3 0.0005 0.0005 0.0005 0.0004 0.0004 0.0004 0.0004 0.0004 0.0004 0.0003 -3.3
-3.2
0.0007 0.0007 0.0006 0.0006 0.0006 0.0006 0.0006 0.0005 0.0005 0.0005 -3.2
-3.1 0.0010 0.0009 0.0009 0.0009 0.0008 0.0008 0.0008 0.0008 0.0007 0.0007 -3.1
-3.0 0.0013 0.0013 0.0013 0.0012 0.0012 0.0011 0.0011 0.0011 0.0010 0.0010 -3.0
-2.9 0.0019 0.0018 0.0018 0.0017 0.0016 0.0016 0.0015 0.0015 0.0014 0.0014 -2.9
-2.8
0.0026 0.0025 0.0024 0.0023 0.0023 0.0022 0.0021 0.0021 0.0020 0.0019 -2.8
-2.7 0.0035 0.0034 0.0033 0.0032 0.0031 0.0030
0.0027 0.0026 -2.7
-2.6 0.0047 0.0045 0.0044 0.0043 0.0041 0.0040 0.0039
-2.5 0.0062 0.0060 0.0059 0.0057 0.0055 0.0054 0.0052
-2.4 0.0082 0.0080 0.0078 0.0075 0.0073 0.0071 0.0069
-2.3 0.0107 0.0104 0.0102 0.0099 0.0096 0.0094 0.0091
-2.2 0.0139 0.0136 0.0132 0.0129 0.0125 0.0122 0.0119
-2.1 0.0179 0.0174 0.0170 0.0166 0.0162 0.0158
-2.0 0.0228 0.0222 0.0217 0.0212 0.0207 0.0202
-1.9 0.0287 0.0281 0.0274 0.0268 0.0262 0.0256 0.0250
-1.8 0.0359 0.0351 0.0344 0.0336 0.0329 0.0322 0.0314 0.0307
-1.7 0.0446 0.0436 0.0427 0.0418 0.0409 0.0401 0.0392 0.0384
-1.6 0.0548 0.0537 0.0526 0.0516 0.0505 0.0495 0.0485 0.0475
-1.5 0.0668 0.0655 0.0643 0.0630 0.0618 0.0606 0.0594 0.0582
-1.4 0.0808 0.0793 0.0778 0.0764 0.0749 0.0735 0.0721 0.0708
-1.3 0.0968 0.0951 0.0934 0.0918 0.0901 0.0885 0.0869 0.0853
-1.2
0.1151 0.1131 0.1112 0.1093 0.1075 0.1056 0.1038 0.1020
-1.1
0.1357 0.1335 0.1314 0.1292 0.1271 0.1251 0.1230 0.1210
-1.0 0.1587 0.1562 0.1539 0.1515 0.1492 0.1469 0.1446 0.1423
-0.9 0.1841 0.1814 0.1788 0.1762 0.1736 0.1711 0.1685 0.1660
-0.8 0.2119 0.2090 0.2061 0.2033 0.2005 0.1977 0.1949 0.1922 0.1894
-0.7 0.2420 0.2389 0.2358 0.2327 0.2296 0.2266 0.2236 0.2206 0.2177 0.2148 -0.7
-0.6 0.2743 0.2709 0.2676 0.2643 0.2611 0.2578 0.2546 0.2514 0.2483 0.2451 -0.6
-0.5 0.3085 0.3050 0.3015 0.2981 0.2946 0.2912 0.2877 0.2843 0.2810 0.2776 -0.5
-0.4 0.3446 0.3409 0.3372 0.3336 0.3300 0.3264 0.3228 0.3192 0.3156 0.3121 -0.4
-0.3 0.3821 0.3783 0.3745 0.3707 0.3669 0.3632 0.3594 0.3557 0.3520 0.3483 -0.3
-0.2 0.4207 0.4168 0.4129 0.4090 0.4052 0.4013 0.3974 0.3936 0.3897 0.3859 -0.2
-0.1 0.4602 0.4562 0.4522 0.4483 0.4443 0.4404 0.4364 0.4325 0.4286 0.4247 -0.1
-0.0 0.5000 0.4960 0.4920 0.4880 0.4840 0.4801 0.4761 0.4721 0.4681 0.4641 -0.0
.00
.01
.02
.03
.04
.05
.06
.07
.08 .09
Areas under the Normal Curve
.00
0.0
0.0029
0.0028
0.0038
0.0037
0.0036 -2.6
0.0051
0.0049
0.0048 -2.5
0.9
.01 .02
.03
.04
.05
.06 .07 .08
.09
0.5000 0.5040 0.5080 0.5120 0.5160 0.5199 0.5239 0.5279 0.5319 0.5359 0.0
0.1 0.5398 0.5438 0.5478 0.5517 0.5557 0.5596 0.5636 0.5675 0.5714 0.5753 0.1
0.2 0.5793 0.5832 0.5871 0.5910 0.5948 0.5987 0.6026 0.6064 0.6103 0.6141 0.2
0.3
0.6179 0.6217 0.6255 0.6293 0.6331 0.6368 0.6406 0.6443 0.6480 0.6517
0.3
0.4 0.6554 0.6591 0.6628 0.6664 0.6700 0.6736 0.6772 0.6808 0.6844 0.6879 0.4
0.5 0.6915 0.6950 0.6985 0.7019 0.7054 0.7088 0.7123 0.7157 0.7190 0.7224 0.5
0.6 0.7257 0.7291 0.7324 0.7357 0.7389 0.7422 0.7454 0.7486 0.7517 0.7549 0.6
0.7 0.7580 0.7611 0.7642 0.7673 0.7704 0.7734 0.7764 0.7794 0.7823 0.7852 0.7
0.8
0.7881 0.7910 0.7939 0.7967 0.7995 0.8023 0.8051 0.8078 0.8106 0.8133 0.8
0.8159 0.8186 0.8212 0.8238 0.8264 0.8289 0.8315 0.8340 0.8365 0.8389 0.9
0.0068
0.0066
0.0064 -2.4
1.0
0.0089
0.0087
0.0084 -2.3
1.1
0.0116
0.0113
0.0110 -2.2
1.2
0.0154
0.0150
0.0146
0.0143 -2.1
1.3
0.0197
0.0192
0.0188
0.0183 -2.0
1.4
0.8413 0.8438 0.8461 0.8485 0.8508 0.8531 0.8554 0.8577 0.8599 0.8621 1.0
0.8643 0.8665 0.8686 0.8708 0.8729 0.8749 0.8770 0.8790 0.8810 0.8830 1.1
0.8849 0.8869 0.8888 0.8907 0.8925 0.8944 0.8962 0.8980 0.8997 0.9015 1.2
0.9032 0.9049 0.9066 0.9082 0.9099 0.9115 0.9131 0.9147 0.9162 0.9177 1.3
0.9192 0.9207 0.9222 0.9236 0.9251 0.9265 0.9279 0.9292 0.9306 0.9319
1.4
0.0244
0.0239 0.0233 -1.9
1.5
0.0301
0.0294 -1.8
1.6
0.0375
0.0367 -1.7
1.7
0.0465
0.0455 -1.6
1.8
0.0571
0.0559 -1.5
1.9
0.0694
0.0681 -1.4
2.0
0.0838
0.0823 -1.3
2.1
0.1003
0.0985 -1.2
2.2
0.1190
0.1170 -1.1
2.3
0.1401
0.1379 -1.0
2.4
0.1635
0.1611 -0.9
2.5
0.1867 -0.8
2.6
3.2
с
¡A
3.3
3.4
0.9332 0.9345 0.9357 0.9370 0.9382 0.9394 0.9406 0.9418 0.9429 0.9441 1.5
0.9452 0.9463 0.9474 0.9484 0.9495 0.9505 0.9515 0.9525 0.9535 0.9545 1.6
0.9554 0.9564 0.9573 0.9582 0.9591 0.9599 0.9608 0.9616 0.9625 0.9633 1.7
0.9641 0.9649 0.9656 0.9664 0.9671 0.9678 0.9686 0.9693 0.9699 0.9706 1.8
0.9713 0.9719 0.9726 0.9732 0.9738 0.9744 0.9750 0.9756 0.9761 0.9767 1.9
0.9772 0.9778 0.9783 0.9788 0.9793 0.9798 0.9803 0.9808 0.9812 0.9817 2.0
0.9821 0.9826 0.9830 0.9834 0.9838 0.9842 0.9846 0.9850 0.9854 0.9857 2.1
0.9861 0.9864 0.9868 0.9871 0.9875 0.9878 0.9881 0.9884 0.9887 0.9890 2.2
0.9893 0.9896 0.9898 0.9901 0.9904 0.9906 0.9909 0.9911 0.9913 0.9916 2.3
0.9918 0.9920 0.9922 0.9925 0.9927 0.9929 0.9931 0.9932 0.9934 0.9936 2.4
0.9938 0.9940 0.9941 0.9943 0.9945 0.9946 0.9948 0.9949 0.9951 0.9952 2.5
0.9953 0.9955 0.9956 0.9957 0.9959 0.9960 0.9961 0.9962 0.9963 0.9964 2.6
2.7 0.9965 0.9966 0.9967 0.9968 0.9969 0.9970 0.9971 0.9972 0.9973 0.9974 2.7
2.8 0.9974 0.9975 0.9976 0.9977 0.9977 0.9978 0.9979 0.9979 0.9980 0.9981 2.8
2.9 0.9981 0.9982 0.9982 0.9983 0.9984 0.9984 0.9985 0.9985 0.9986 0.9986 2.9
3.0
0.9987 0.9987 0.9987 0.9988 0.9988 0.9989 0.9989 0.9989 0.9990 0.9990 3.0
3.1 0.9990 0.9991 0.9991 0.9991 0.9992 0.9992 0.9992 0.9992 0.9993 0.9993 3.1
0.9994 0.9995 0.9995 0.9995 3.2
0.9993 0.9993 0.9994 0.9994 0.9994 0.9994
0.9995 0.9995 0.9995 0.9996 0.9996 0.9996
0.9997 0.9997 0.9997 0.9997 0.9997 0.9997 0.9997 0.9997 0.9997 0.9998 3.4
0.9996 0.9996 0.9996 0.9997 3.3
B
.00
.01
.02
.03
.04
.05
.06
.07
.08
.09

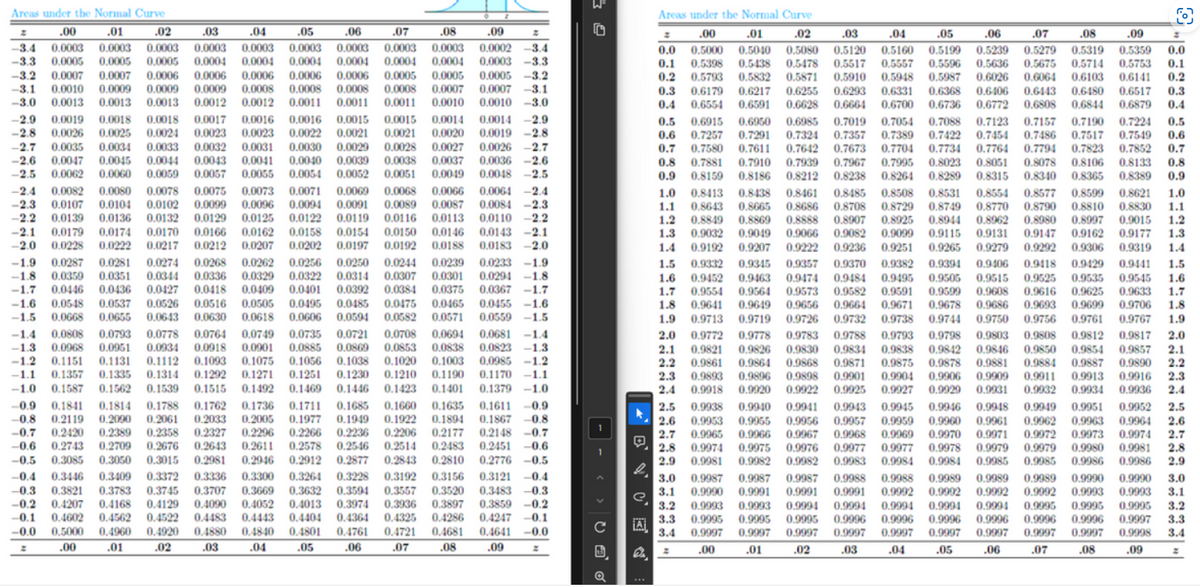
Transcribed Image Text:According to Chebyshev's theorem, the probability that any random variable assumes a value within 3 standard
8
deviations of the mean is at least. If it is known that the probability distribution of a random variable X is normal
with mean μ and variance o², what is the exact value of P(μ-30 <X<μ+30)?
Click here to view page 1 of the standard normal distribution table.
Click here to view page 2 of the standard normal distribution table.
P(μ-30<x<μ+3)=
(Round to four decimal places as needed.)
Expert Solution
This question has been solved!
Explore an expertly crafted, step-by-step solution for a thorough understanding of key concepts.

Step by stepSolved in 3 steps with 6 images

Knowledge Booster

Similar questions
arrow_back_ios
arrow_forward_ios
Recommended textbooks for you
- A First Course in Probability (10th Edition)ProbabilityISBN:9780134753119Author:Sheldon RossPublisher:PEARSON

A First Course in Probability (10th Edition)
Probability
ISBN:9780134753119
Author:Sheldon Ross
Publisher:PEARSON