MATLAB: An Introduction with Applications
6th Edition
ISBN: 9781119256830
Author: Amos Gilat
Publisher: John Wiley & Sons Inc
expand_more
expand_more
format_list_bulleted
Question

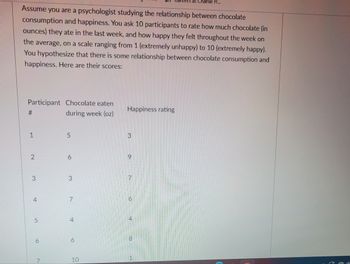
Transcribed Image Text:**Exploration of Chocolate Consumption and Happiness**
Assume you are a psychologist studying the relationship between chocolate consumption and happiness. You ask 10 participants to rate how much chocolate (in ounces) they ate in the last week, and how happy they felt throughout the week on average, on a scale ranging from 1 (extremely unhappy) to 10 (extremely happy). You hypothesize that there is some relationship between chocolate consumption and happiness. Here are their scores:
| Participant # | Chocolate eaten during week (oz) | Happiness rating |
|---------------|---------------------------------|------------------|
| 1 | 5 | 3 |
| 2 | 6 | 9 |
| 3 | 3 | 7 |
| 4 | 7 | 6 |
| 5 | 4 | 4 |
| 6 | 6 | 8 |
| 7 | 10 | 1 |
| 8 | 2 | 5 |
| 9 | 8 | 9 |
| 10 | 9 | 7 |
This data can be used to explore possible correlations between the amount of chocolate consumed and perceived happiness levels.

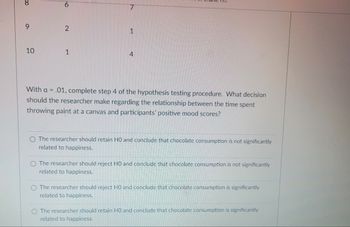
Transcribed Image Text:**Transcription for Educational Website:**
---
With α = .01, complete step 4 of the hypothesis testing procedure. What decision should the researcher make regarding the relationship between the time spent throwing paint at a canvas and participants' positive mood scores?
- O The researcher should retain H₀ and conclude that chocolate consumption is not significantly related to happiness.
- O The researcher should reject H₀ and conclude that chocolate consumption is not significantly related to happiness.
- O The researcher should reject H₀ and conclude that chocolate consumption is significantly related to happiness.
- O The researcher should retain H₀ and conclude that chocolate consumption is significantly related to happiness.
---
**Explanation:**
In this task, the researcher is asked to determine the appropriate decision regarding the null hypothesis (H₀) based on the significance level (α) of 0.01. The text mistakenly mentions "chocolate consumption" when referring to the relationship between time spent in an activity and the resulting mood. The decision involves either retaining or rejecting the null hypothesis, which has implications for understanding the significance of the relationship studied.
Expert Solution
This question has been solved!
Explore an expertly crafted, step-by-step solution for a thorough understanding of key concepts.
This is a popular solution
Trending nowThis is a popular solution!
Step by stepSolved in 3 steps with 2 images

Knowledge Booster
Similar questions
- Research indicates that stress levels are lowered when petting a dog. . A mood inventory questionnaire is administered to a group of 20-29 - year olds with no do present in the room, and again a month later the same mood questionnaire is administered to the same people with a dog present in the room. Is there a significant difference in the mood scores for when the dog was present or not? Test with a = .05 for two tails. Person No Dog in Room Dog in Room A 12 14 B 8 7 C 10 13 D 9 9 E 7 13 F 10 12arrow_forwardA cognitive psychologist conducted a study of whether familiarity of words (X) predicts the time it takes (in seconds) to press a button indicating whether the word is singular or plural (Y), with all participants being given the same words. Familiarity with these words was rated at a later time on a 7-point scale (with higher numbers indicating more familiarity). The participants' scores were: X : 6, 2, 5 ,3 ,7 Y : 0.3 , 1.5 , 0.8 , 1.4 ,0.1 a.Figure the correlation coefficient Describe the correlation Figure the linear prediction rule; list the b value, a value and the final formula Predict the time it takes to press a button if the familiarity with the word is 1arrow_forwardAccording to the Pew Research Center, 14% of adults rate basketball as their favorite sport. Your boss believes the proportion may be lower among adults over age 65, and wants you to collect evidence to see if this is true. You take a survey of adults over age 65, and only 12 out of 120 of them rate basketball as their favorite sport. You would like to set �=0.05. Your boss tells you that your firm will base some expensive decisions on the results of your hypothesis test, so a higher standard of evidence for rejecting the null hypothesis is needed. What should you do? Group of answer choices Keep the significance level the same but collect more data Increase the significance level to 10% Reduce the significance level to 1% Throw out observations that look suspicious thanksarrow_forward
- A. Write the hypothesis and null you believe the researcher is testing. B. Make a claim about this hypothesis test; noting form, degree, and significance in yourclaim. C. Make a claim about the overall fit of the model (significance, variance explained). D. Discuss a plausible potential control variable you would want to include and the impact that you would speculate it to have on this relationship. (For example, what type of control is your variable, how will it alter the relationship between the DV and the IV, etc.).arrow_forwardA graduate student is interested in how viewing different types of scenes affects working memory. For his study, he selects a random sample of 36 adults. The subjects complete a series of working memory tests before and after walking in an urban setting. Before the walk, the mean score on the test of working memory was 9.1. After the walk, the mean score was 1.4 higher. The graduate student has no presupposed assumptions about how viewing different types of scenes affects working memory, so he formulates the null and alternative hypotheses as: H00 : μDD = 0 H11 : μDD ≠ 0 Assume that the data satisfy all of the required assumptions for a repeated-measures t test. The graduate student calculates the following statistics for his hypothesis test: Mean difference (MDD) 1.4 Estimated population standard deviation of the differences (s) 1.6 Estimated standard error of the mean differences (sMDMD) 0.2667 Degrees of freedom (df) 35 The t statistic 5.25 The critical values of t…arrow_forwardst is 22. Oishi and Shigehiro (2010) report that people who move from home to home frequently as children tend to have lower than average levels of well-being as adults. To further examine this relationship, a psychologist obtains a sample of n = 12 young adults who each experienced 5 or more different homes before they were 16 years old. These participants were given a standardized well-being questionnaire for which the general population has aarrow_forward
- The director of student services at Oxnard College is interested in whether women are just as likely to attend orientation as men before they begin their coursework. A random sample of freshmen at Oxnard College were asked what their gender is and whether they attended orientation. The results of the survey are shown below: Data for Gender vs. Orientation Attendance Women Men Yes 440 410 No 238 239 What can be conduded at the a - 0.10 level of significance? For this study, we should use z-test for a population proportion a. The null and alternative hypotheses would be: Ho: Select an answer v Select an answer v Select an answer v (please enter a decimal and note that p1 and ul represent the proportion and mean women and and u2 represent proportion and mean for men.) H: Select an answer v Select an answer v Select an answer v (Please enter a decimal) b. The test statistic ? v (please show your answer to 3 decimal places.) c. The p-value = (Please show your answer to 4 decimal places.) d.…arrow_forwardA researcher investigates the relationship between study habits and college achievement. College seniors were administered the Inventory of Study Habits Survey (X) to measure study habits and the College BASE (Y) was used to measure overall college achievement. The correlation between the study habits and achievement was found to be 0.784. The researcher concluded that students with higher scores on the Study Habits Survey will always have higher college achievement scores on the College BASE. Is the researcher's conclusion correct? Why or why not?arrow_forward
arrow_back_ios
arrow_forward_ios
Recommended textbooks for you
 MATLAB: An Introduction with ApplicationsStatisticsISBN:9781119256830Author:Amos GilatPublisher:John Wiley & Sons Inc
 Probability and Statistics for Engineering and th...StatisticsISBN:9781305251809Author:Jay L. DevorePublisher:Cengage Learning
 Statistics for The Behavioral Sciences (MindTap C...StatisticsISBN:9781305504912Author:Frederick J Gravetter, Larry B. WallnauPublisher:Cengage Learning
 Elementary Statistics: Picturing the World (7th E...StatisticsISBN:9780134683416Author:Ron Larson, Betsy FarberPublisher:PEARSON
 The Basic Practice of StatisticsStatisticsISBN:9781319042578Author:David S. Moore, William I. Notz, Michael A. FlignerPublisher:W. H. Freeman
 Introduction to the Practice of StatisticsStatisticsISBN:9781319013387Author:David S. Moore, George P. McCabe, Bruce A. CraigPublisher:W. H. Freeman

MATLAB: An Introduction with Applications
Statistics
ISBN:9781119256830
Author:Amos Gilat
Publisher:John Wiley & Sons Inc

Probability and Statistics for Engineering and th...
Statistics
ISBN:9781305251809
Author:Jay L. Devore
Publisher:Cengage Learning

Statistics for The Behavioral Sciences (MindTap C...
Statistics
ISBN:9781305504912
Author:Frederick J Gravetter, Larry B. Wallnau
Publisher:Cengage Learning

Elementary Statistics: Picturing the World (7th E...
Statistics
ISBN:9780134683416
Author:Ron Larson, Betsy Farber
Publisher:PEARSON

The Basic Practice of Statistics
Statistics
ISBN:9781319042578
Author:David S. Moore, William I. Notz, Michael A. Fligner
Publisher:W. H. Freeman

Introduction to the Practice of Statistics
Statistics
ISBN:9781319013387
Author:David S. Moore, George P. McCabe, Bruce A. Craig
Publisher:W. H. Freeman