
Essentials Of Investments
11th Edition
ISBN: 9781260013924
Author: Bodie, Zvi, Kane, Alex, MARCUS, Alan J.
Publisher: Mcgraw-hill Education,
expand_more
expand_more
format_list_bulleted
Related questions
Question
thumb_up100%
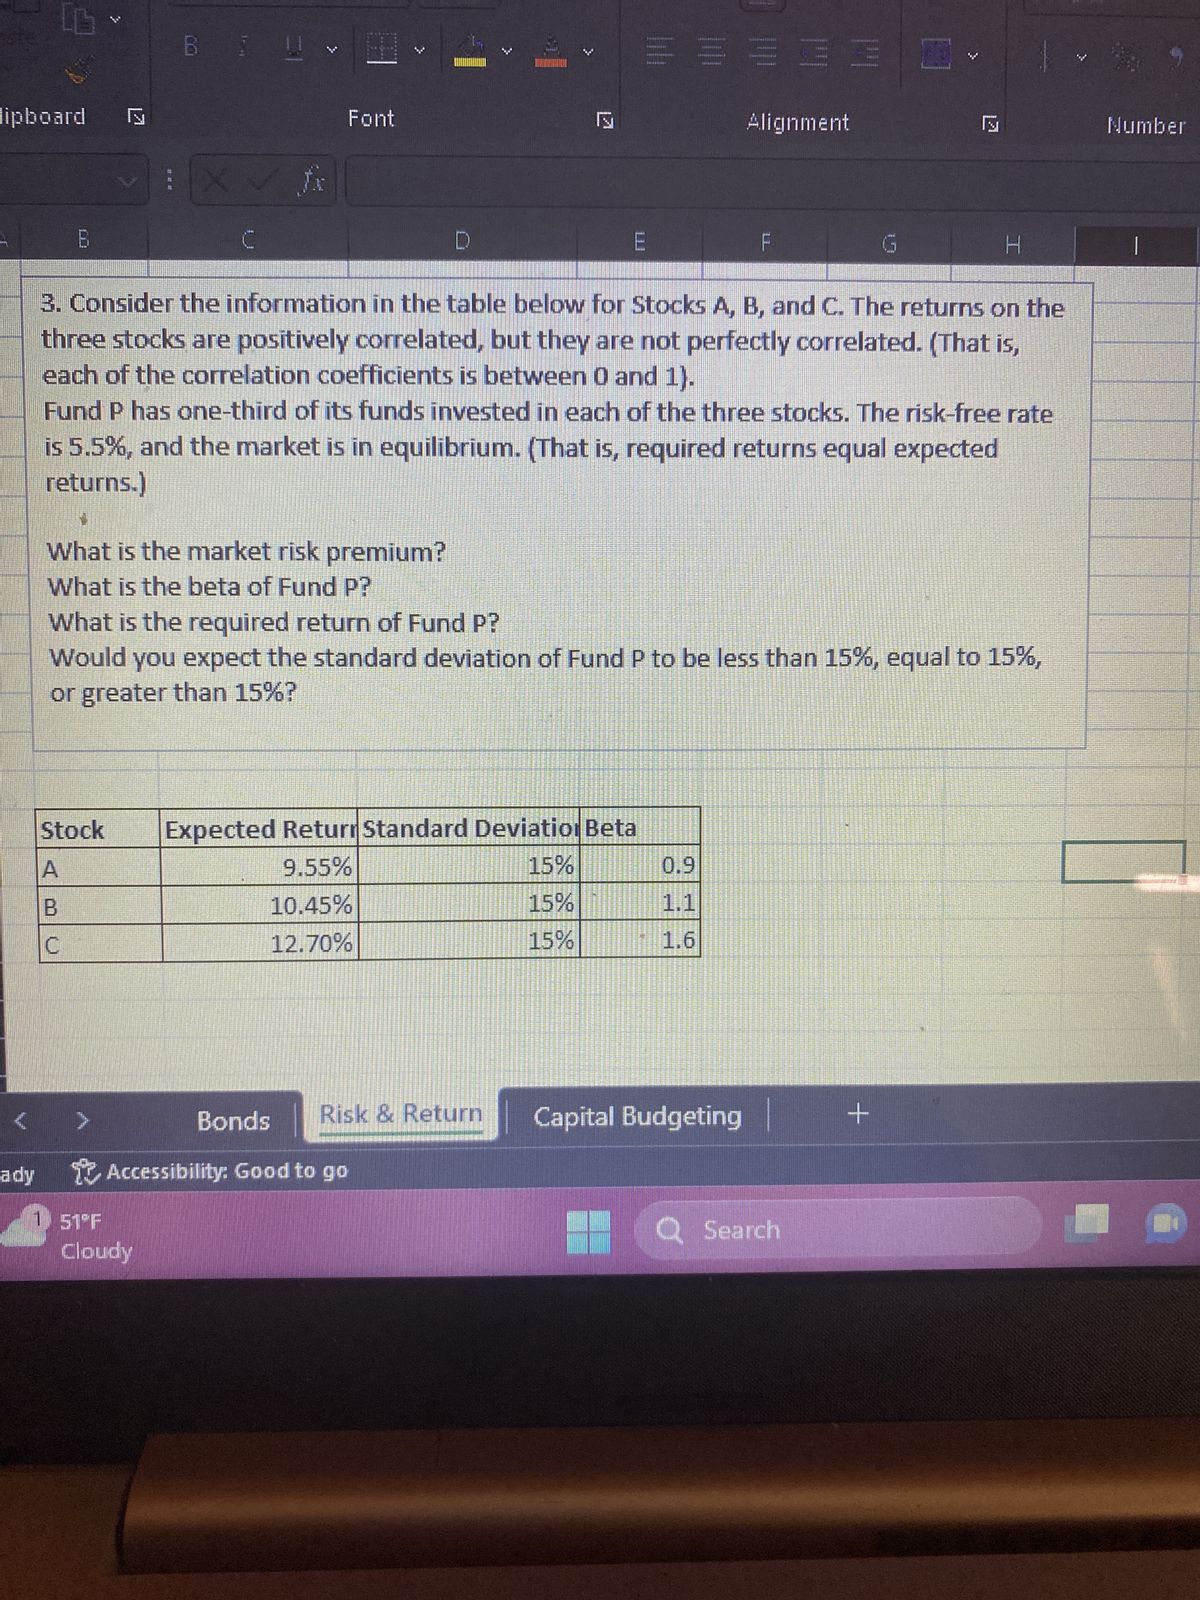

Transcribed Image Text:**Understanding Stock Portfolio Risks and Returns**
Consider the following information on three stocks, A, B, and C. The returns on these stocks are positively correlated, yet not perfectly so. This implies that although the stocks tend to move in the same direction, they do not move in perfect harmony (this is based on the correlation coefficients which lie between 0 and 1).
**Investment Fund P** has one-third of its funds invested equally in each of these three stocks. The risk-free rate is set at 5.5%, and the market is in equilibrium, which means the expected returns are equal to the required returns.
**Analysis Questions:**
1. What is the market risk premium?
2. What is the beta of Fund P?
3. What is the required return of Fund P?
4. Is the standard deviation of Fund P expected to be less than, equal to, or greater than 15%?
**Table Overview:**
| Stock | Expected Return | Standard Deviation | Beta |
|-------|-----------------|--------------------|------|
| A | 9.55% | 15% | 0.9 |
| B | 10.45% | 15% | 1.1 |
| C | 12.70% | 15% | 1.6 |
- **Expected Return**: This represents the average return anticipated on the stock.
- **Standard Deviation**: This shows the extent to which the return on the stock is expected to vary.
- **Beta**: A measure of the stock's volatility in relation to the market. A beta higher than 1 indicates that the stock is more volatile than the market, whereas a beta less than 1 indicates lower volatility.
These components are crucial for evaluating the risk and potential return of investments in these stocks and for constructing an efficient, diversified portfolio.
Expert Solution
This question has been solved!
Explore an expertly crafted, step-by-step solution for a thorough understanding of key concepts.

This is a popular solution

Trending nowThis is a popular solution!

Step by stepSolved in 5 steps with 4 images

Follow-up Questions
Read through expert solutions to related follow-up questions below.
Follow-up Question
Would you expect the standard deviation of Fund P to be less than 15%, equal to 15% or greater than 15%?
Solution
by Bartleby Expert
Follow-up Question
Why is there conflict between the NPV and IRR criteria between projects Y and Z? Which is typically considered the best decision criteria to use and why?
Solution
by Bartleby Expert
Knowledge Booster


Learn more about
Need a deep-dive on the concept behind this application? Look no further. Learn more about this topic, finance and related others by exploring similar questions and additional content below.Similar questions
- Assume the CAPM holds and consider stock X, which has a return variance of 0.09 and a correlation of 0.75 with the market portfolio. The market portfolio's Sharpe ratio is 0.30 and the the risk-free rate is 5%. (a) What is Stock X's expected return? (b) What proportion of Stock X's return volatility (i.e. standard deviation) is priced by the market? Explain why this number is less than 1.arrow_forwardb. Consider the following information about three stocks: Probability of State of i. ii. iii. iv. State of Economy V. Boom Recession Economy 0.40 0.60 From the information given, you are required to answer the following questions. Compute the Standard Deviation for each stock. Compute the Coefficient Variation for each stock. Based on your computation in part (i) and (ii), which stock is riskier? Explain your answer. Rate of Return if State Occurs Stock Hang Stock Hang Jebat 7% 13% Tuah 28% (5%) Stock Hang Kasturi 15% 3% Assume that you have RM14,000 invested in Stock Hang Jebat whose beta is 1.5, RM19,000 invested in Stock Hang Kasturi whose beta is 2.5 and RM17,000 invested in Stock Hang Tuah whose beta is 1.6. Determine what is the beta of this portfolio. Based on your answer in part (iv), compute the required rate of return for this portfolio, given that the market rate of return is 13% and risk-free rate is 5%.arrow_forwardSuppose that many stocks are traded in the market and that it is possible to borrow at the risk-free rate, rƒ. The characteristics of two of the stocks are as follows: Stock Expected Return Standard Deviation A 8% 55% B 4% 45% Correlation = −1 Required: a. Calculate the expected rate of return on this risk-free portfolio? (Hint: Can a particular stock portfolio be formed to create a “synthetic” risk-free asset?) (Round your answer to 2 decimal places.) b. Could the equilibrium rƒ be greater than rate of return?arrow_forward
- Consider the following information for stocks A, B, and C. The returns on the three stocks are positively correlated, but they are not perfectly correlated. (That is, each of the correlation coefficients is between 0 and 1.) Stock Expected Return Standard Deviation Beta A 6.95% 15% 0.7 B 8.35 15 1.1 C 10.45 15 1.7 Fund P has one-third of its funds invested in each of the three stocks. The risk-free rate is 4.5%, and the market is in equilibrium. (That is, required returns equal expected returns.) What is the market risk premium (rM - rRF)? Round your answer to one decimal place. % What is the beta of Fund P? Do not round intermediate calculations. Round your answer to two decimal places. What is the required return of Fund P? Do not round intermediate calculations. Round your answer to two decimal places. % What would you expect the standard deviation of Fund P to be? Less than 15% Greater than 15% Equal to 15%arrow_forwardThe Capital Asset Pricing Model (CAPM) says that the risk premium on a stock is equal to its beta times the market risk premium. ..... True Falsearrow_forwardConsider the following single factor specification: R₁ = a¡ + ßi, Rµ + €i. Where R; is the return on security i, RM is the return on index M (a broad market index) and e, is a zero- mean white noise random variable not correlated with anything. Assume that the single factor specification above correctly describes the return generating processes of all securities. Furthermore, you have the following descriptive statistics for returns of well-diversified Portfolios X, Y, and index M. Portfolio X Portfolio Y Index M Risk-Free Expected return 14% 17% ?? ?? B₁ 1.2 1.6 1 0 a. Assume that the corresponding single factor APT correctly prices Portfolios X and Y. In other words, the expected returns of Portfolios X and Y shown above - 14% and 17% respectively - are equal to their APT-predicted expected returns. Calculate the expected return of Index M and risk-free rate. b. Another well-diversified portfolio Z has a beta, ßz, of 0.8 while its expected return is 10%. Form a portfolio consisting…arrow_forward
- Consider the following securities: state Probability A B A B H M L 0.2 0.5 0.3 с 6 10 6 3 7 12 2 5 14 1. The expected payoff of A is: 2. The standard deviation of A is: 3. If the price of A is 3, its expected return is: 4. The covariance between A and B is: 5. The correlation coefficient between A and B is: 6. Is it possible to build a portfolio that has zero variance using A and C? YES/ NOarrow_forwardConsider the following information for stocks A, B, and C. The returns on the three stocks are positively correlated, but they are not perfectly correlated. (That is, each of the correlation coefficients is between 0 and 1.) Stock Expected Return Standard Deviation Beta 16% 0.8 B 16 1.2 с 8.50 16 1.6 Fund P has one-third of its funds invested in each of the three stocks. The risk-free rate is 4.5%, and the market is in equilibrium. (That is, required returns equal expected returns.) a. What is the market risk premium (re-ra)? Round your answer to one decimal place. b. What is the beta of Fund P? Do not round intermediate calculations. Round your answer to two decimal places. c. What is the required return of Fund P? Do not round intermediate calculations. Round your answer to two decimal places. % d. What would you expect the standard deviation of Fund P to be? 1. Less than 16% II. Greater than 16% III. Equal to 16% -Select- 6.50% 7.50arrow_forwardA stock has a correlation with the market of 0.4. If the Sharpe ratio of the market portfolio is 0.7, what is the Sharpe ratio of the stock? (Hint: algebraically manipulate the SML equation.) 0.28 0.75C. 0.60D. 0.55arrow_forward
- 1. Stock Y has a beta of 1.2 and an expected return of 11.1 percent. Stock Z has a beta of .8 and an expected return of 7.85 percent. If the risk-free rate is 2.4 percent and the market risk premium is 7.2 percent, the reward-to-risk ratios for stocks Y and Z are ____ and ____ percent, respectively. Since the SML reward-to-risk is ____ percent, Stock Y is ____(undervalued/ overvalued) and Stock Z is ____(undervalued/ overvalued).arrow_forwardConsider the following information for stocks A, B, and C. The returns on the three stocks are positively correlated, but they are not perfectly correlated. (That is, each of the correlation coefficients is between 0 and 1.) Stock Expected Return Standard Deviation Beta A B с 9.30% 10.35 12.10 14% 14 14 0.8 1.1 1.6 Fund P has one-third of its funds invested in each of the three stocks. The risk-free rate is 6.5%, and the market is in equilibrium. (That is, required returns equal expected returns.) a. What is the market risk premium (гM-TRF)? Round your answer to one decimal place. % b. What is the beta of Fund P? Do not round intermediate calculations. Round your answer to two decimal places. c. What is the required return of Fund P? Do not round intermediate calculations. Round your answer to two decimal places. % d. What would you expect the standard deviation of Fund P to be? I. Less than 14% II. Greater than 14% III. Equal to 14% -Select-arrow_forward
arrow_back_ios
arrow_forward_ios
Recommended textbooks for you
- Essentials Of InvestmentsFinanceISBN:9781260013924Author:Bodie, Zvi, Kane, Alex, MARCUS, Alan J.Publisher:Mcgraw-hill Education,


 Foundations Of FinanceFinanceISBN:9780134897264Author:KEOWN, Arthur J., Martin, John D., PETTY, J. WilliamPublisher:Pearson,
 Fundamentals of Financial Management (MindTap Cou...FinanceISBN:9781337395250Author:Eugene F. Brigham, Joel F. HoustonPublisher:Cengage Learning
 Corporate Finance (The Mcgraw-hill/Irwin Series i...FinanceISBN:9780077861759Author:Stephen A. Ross Franco Modigliani Professor of Financial Economics Professor, Randolph W Westerfield Robert R. Dockson Deans Chair in Bus. Admin., Jeffrey Jaffe, Bradford D Jordan ProfessorPublisher:McGraw-Hill Education
Essentials Of Investments
Finance
ISBN:9781260013924
Author:Bodie, Zvi, Kane, Alex, MARCUS, Alan J.
Publisher:Mcgraw-hill Education,
Foundations Of Finance
Finance
ISBN:9780134897264
Author:KEOWN, Arthur J., Martin, John D., PETTY, J. William
Publisher:Pearson,
Fundamentals of Financial Management (MindTap Cou...
Finance
ISBN:9781337395250
Author:Eugene F. Brigham, Joel F. Houston
Publisher:Cengage Learning
Corporate Finance (The Mcgraw-hill/Irwin Series i...
Finance
ISBN:9780077861759
Author:Stephen A. Ross Franco Modigliani Professor of Financial Economics Professor, Randolph W Westerfield Robert R. Dockson Deans Chair in Bus. Admin., Jeffrey Jaffe, Bradford D Jordan Professor
Publisher:McGraw-Hill Education