MATLAB: An Introduction with Applications
6th Edition
ISBN: 9781119256830
Author: Amos Gilat
Publisher: John Wiley & Sons Inc
expand_more
expand_more
format_list_bulleted
Question

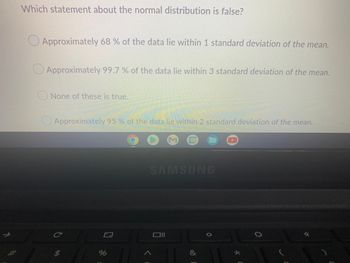
Transcribed Image Text:Which statement about the normal distribution is false?
Approximately 68 % of the data lie within 1 standard deviation of the mean.
Approximately 99.7% of the data lie within 3 standard deviation of the mean.
None of these is true.
Approximately 95% of the data lie within 2 standard deviation of the mean.
SAMSUNG
C
Oll
%
&
★
Expert Solution
This question has been solved!
Explore an expertly crafted, step-by-step solution for a thorough understanding of key concepts.
Step by stepSolved in 2 steps with 2 images

Knowledge Booster
Similar questions
- a variable has a mean of 100 and a standard deviation of 36. Sixteen observations of this variable have a mean of 115 and a sample standard deviation of 24. Determine the observed value of the a. standardized version of xbar. b. studentized version of xbar.arrow_forwardLet X be the resting heart rate of a physically fit man. Assume that the resting heart rate for fit men follows a normal distribution with a mean of 60 and a standard deviation of 10. Let X bar be the sample mean resting heart rate for a randomly chosen sample of 35 fit men. what value is the 95th percentile of all sample me and resting heart rates?arrow_forwardHi please help. Thank you. Among coffee drinkers, men drink a mean of 3.2 cups per day with a standard deviation of 0.8 cups. Assume the number of coffee drinks per day follows a normal distribution. What proportion drink no more than 4 cups per day?arrow_forward
- A student will spend 15 hours average each week in class. If the standard deviation is 2 hours, what percentage of students spend less than 12 hours in class?arrow_forwardA mandatory competency test for high school sophomores has a normal distribution with a mean of 470 and a standard deviation of 140. The top 5.6%of students receive$500 What is the minimum score you would need to receive this award? The minimum score needed to receive the award isarrow_forwardAmericans love ice cream .The annual per capita consumption of ice cream ,in pounds ,in the united states can be approximately by a normal distribution with mean 16.5 lbs and standard deviation 2.5 lbs what percent of Americans eat less than 14 lbs of ice cream each year ?arrow_forward
- The manager at UPS feels that the weights of packages shipped recently are less than in he past. Records show that in the past packages have had a population mean weight of 36.7 pounds and a population standard deviation of 14.2 pounds. A random sample of last month's shipping records yielded a sample mean weight of 32.1 pounds for 64 packages. Does this indicate that the weights of packages recently shipped is less than 36.7 pounds? Use a = 0.01. Use the Classical Approach.arrow_forwardPlease see attached.arrow_forwardThe systolic blood pressure of adults in the USA is nearly normally distributed with a mean of 117 and standard deviation of 15 .Someone qualifies as having Stage 2 high blood pressure if their systolic blood pressure is 160 or higher. d. What two values divide this normal curve into a middle 97%, in other words, what two values represent the middle 97% of blood pressures? Put the lower number FIRST! and mmHg e. How many standard deviations away would a blood pressure of 140 be? f. Would this be considered unusual? Not Unusual Very Unusual Somewhat Unusualarrow_forward
- Students in the psychology department at General State University consumes an average of 7 sodas per day with a standard deviation of 2.5. the distribution is normal. Explain how you would go about answering the following questions (include your answer to the question in your response): How many sodas would an individual at the 75thpercentile drink per day?arrow_forwardState two ways the standard deviation differs from the average deviation.arrow_forwardCars on I-40 have a mean speed of 73 MPH at a certain mile marker, with a standard deviation of 8 MPH. What Percentage of Cars averaged at least 78 mph?arrow_forward
arrow_back_ios
SEE MORE QUESTIONS
arrow_forward_ios
Recommended textbooks for you
 MATLAB: An Introduction with ApplicationsStatisticsISBN:9781119256830Author:Amos GilatPublisher:John Wiley & Sons Inc
 Probability and Statistics for Engineering and th...StatisticsISBN:9781305251809Author:Jay L. DevorePublisher:Cengage Learning
 Statistics for The Behavioral Sciences (MindTap C...StatisticsISBN:9781305504912Author:Frederick J Gravetter, Larry B. WallnauPublisher:Cengage Learning
 Elementary Statistics: Picturing the World (7th E...StatisticsISBN:9780134683416Author:Ron Larson, Betsy FarberPublisher:PEARSON
 The Basic Practice of StatisticsStatisticsISBN:9781319042578Author:David S. Moore, William I. Notz, Michael A. FlignerPublisher:W. H. Freeman
 Introduction to the Practice of StatisticsStatisticsISBN:9781319013387Author:David S. Moore, George P. McCabe, Bruce A. CraigPublisher:W. H. Freeman

MATLAB: An Introduction with Applications
Statistics
ISBN:9781119256830
Author:Amos Gilat
Publisher:John Wiley & Sons Inc

Probability and Statistics for Engineering and th...
Statistics
ISBN:9781305251809
Author:Jay L. Devore
Publisher:Cengage Learning

Statistics for The Behavioral Sciences (MindTap C...
Statistics
ISBN:9781305504912
Author:Frederick J Gravetter, Larry B. Wallnau
Publisher:Cengage Learning

Elementary Statistics: Picturing the World (7th E...
Statistics
ISBN:9780134683416
Author:Ron Larson, Betsy Farber
Publisher:PEARSON

The Basic Practice of Statistics
Statistics
ISBN:9781319042578
Author:David S. Moore, William I. Notz, Michael A. Fligner
Publisher:W. H. Freeman

Introduction to the Practice of Statistics
Statistics
ISBN:9781319013387
Author:David S. Moore, George P. McCabe, Bruce A. Craig
Publisher:W. H. Freeman