
MATLAB: An Introduction with Applications
6th Edition
ISBN: 9781119256830
Author: Amos Gilat
Publisher: John Wiley & Sons Inc
expand_more
expand_more
format_list_bulleted
Related questions
Question
( 17 )
• Question is in the photo below

Transcribed Image Text:### Understanding Normal Distribution
**Problem Statement:**
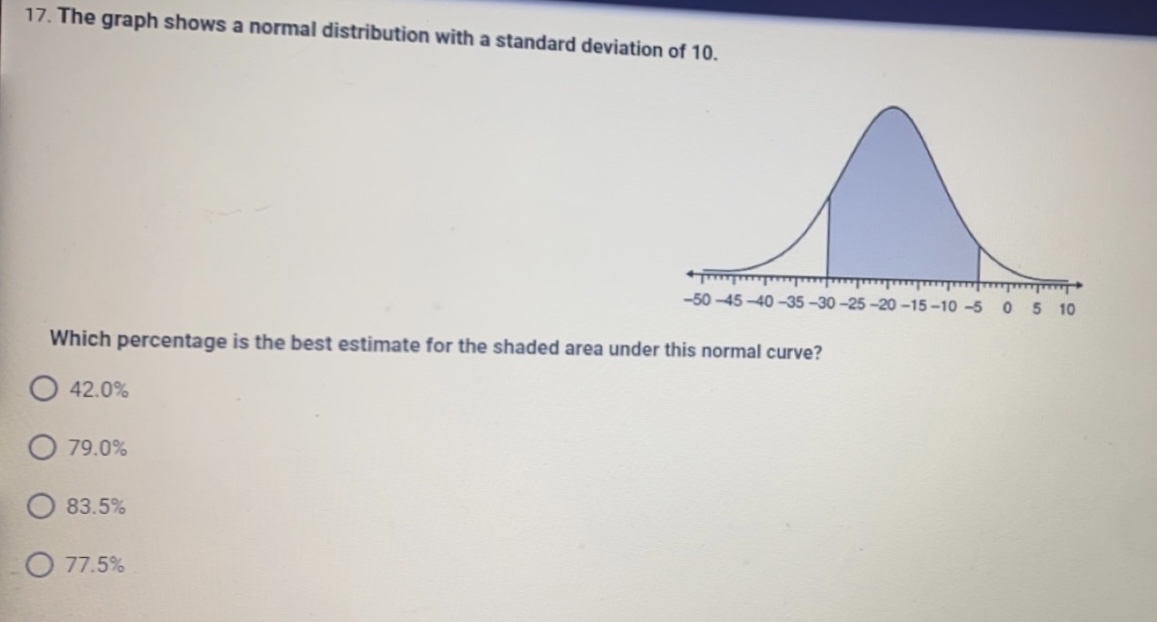
The graph shows a normal distribution with a standard deviation of 10.
17. Which percentage is the best estimate for the shaded area under this normal curve?
**Graph Description:**
The graph represents a normal distribution, also known as a bell curve. The x-axis is marked with intervals from -50 to 10, increasing in increments of 5 units. Standard deviations from the mean are marked accordingly. A specific portion of the curve, ranging approximately from -30 to 0, is shaded. This shading highlights the area under the curve for this range of values.
**Multiple Choice Options:**
- A) 42.0%
- B) 79.0%
- C) 83.5%
- D) 77.5%
**Solution Explanation:**
To determine which percentage is the best estimate for the shaded area, one needs to understand the properties of the normal distribution. The shaded area roughly represents the cumulative probability between -30 and 0 on the x-axis. For a normal distribution:
- About 68% of the data falls within 1 standard deviation of the mean.
- About 95% of the data falls within 2 standard deviations of the mean.
- About 99.7% of the data falls within 3 standard deviations of the mean.
Given that the shaded area appears to span between -3 standard deviations (from -30) to the mean (0), one can deduce the shaded area covers approximately half of the data within this range. This accounts for about 50% of the total distribution (since the mean divides the distribution equally).
Based on this, the closest estimated value is answer choice "B) 79.0%."
**Answer:**
- B) 79.0%
Expert Solution
This question has been solved!
Explore an expertly crafted, step-by-step solution for a thorough understanding of key concepts.

This is a popular solution

Trending nowThis is a popular solution!

Step by stepSolved in 2 steps

Knowledge Booster

Similar questions
- How can I find the average of the record temperatures for these 20 days? 29, 4, 6, -6, -6, 19, -10, -1, -6, 21, -9, 23, 14, 23, 13, 6, 10, 9, 26, 28 without rounding the answer?arrow_forwardA die is rolled two times Provide a list of all the possible outcomes of the two rolls in this form: the result from the first roll and results from the second roll.The answer needs to be done using R which I am confused on how to doarrow_forward
arrow_back_ios
arrow_forward_ios
Recommended textbooks for you
- MATLAB: An Introduction with ApplicationsStatisticsISBN:9781119256830Author:Amos GilatPublisher:John Wiley & Sons Inc
 Probability and Statistics for Engineering and th...StatisticsISBN:9781305251809Author:Jay L. DevorePublisher:Cengage Learning
 Statistics for The Behavioral Sciences (MindTap C...StatisticsISBN:9781305504912Author:Frederick J Gravetter, Larry B. WallnauPublisher:Cengage Learning
  Elementary Statistics: Picturing the World (7th E...StatisticsISBN:9780134683416Author:Ron Larson, Betsy FarberPublisher:PEARSON
 The Basic Practice of StatisticsStatisticsISBN:9781319042578Author:David S. Moore, William I. Notz, Michael A. FlignerPublisher:W. H. Freeman
 Introduction to the Practice of StatisticsStatisticsISBN:9781319013387Author:David S. Moore, George P. McCabe, Bruce A. CraigPublisher:W. H. Freeman
MATLAB: An Introduction with Applications
Statistics
ISBN:9781119256830
Author:Amos Gilat
Publisher:John Wiley & Sons Inc
Probability and Statistics for Engineering and th...
Statistics
ISBN:9781305251809
Author:Jay L. Devore
Publisher:Cengage Learning
Statistics for The Behavioral Sciences (MindTap C...
Statistics
ISBN:9781305504912
Author:Frederick J Gravetter, Larry B. Wallnau
Publisher:Cengage Learning
Elementary Statistics: Picturing the World (7th E...
Statistics
ISBN:9780134683416
Author:Ron Larson, Betsy Farber
Publisher:PEARSON
The Basic Practice of Statistics
Statistics
ISBN:9781319042578
Author:David S. Moore, William I. Notz, Michael A. Fligner
Publisher:W. H. Freeman
Introduction to the Practice of Statistics
Statistics
ISBN:9781319013387
Author:David S. Moore, George P. McCabe, Bruce A. Craig
Publisher:W. H. Freeman