
MATLAB: An Introduction with Applications
6th Edition
ISBN: 9781119256830
Author: Amos Gilat
Publisher: John Wiley & Sons Inc
expand_more
expand_more
format_list_bulleted
Related questions
Question
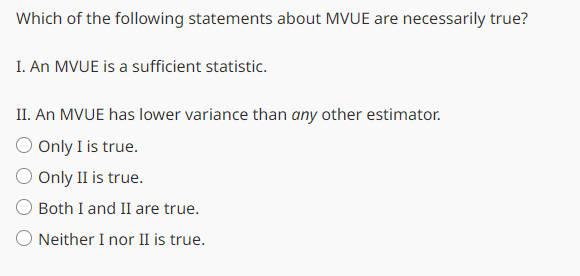

Transcribed Image Text:Which of the following statements about MVUE are necessarily true?
I. An MVUE is a sufficient statistic.
II. An MVUE has lower variance than any other estimator.
O Only I is true.
Only II is true.
Both I and II are true.
Neither I nor II is true.
Expert Solution
This question has been solved!
Explore an expertly crafted, step-by-step solution for a thorough understanding of key concepts.

This is a popular solution

Trending nowThis is a popular solution!

Step by stepSolved in 3 steps with 8 images

Knowledge Booster

Similar questions
- 1) The following 25 scores are from students that participated in a psychology experiment. The scores represent the number of trials required to master a memory task. What is the range, mean, variance, and standard deviation for this dataset? 12 10 12 11 6 15 14 17 9 12 13 8 7 15 14 15 18 19 14 10 14 14 16 8 9arrow_forwardViolation of which assumption below for the two-factor ANVOA is not a cause for concern with large sample sizes? a. The populations from which the samples are selected must have equal variances. b. The populations from which the samples are selected must be normal. c. A violation of any assumption below would be a concern, even with large sample sizes. d. The observations within each sample must be independent.arrow_forwardQ.19 Urgent question! I will thumbs up! In the final answer that you circle, please also include the brief approach / formula you used under "Answer". Thanks!arrow_forward
- The following three independent random samples are obtained from three normally distributed populations with equal variance. The dependent variable is starting hourly wage, and the groups are the types of position (internship, co-op, work study). Group 1: Internship Group 2: Co-op Group 3: Work Study 13 11 15 13.75 13.5 16 8.5 12.75 11 13.5 13.5 15.25 15 13.25 16.25 12.5 14.75 15.5 14.75 13.75 15 13.75 13 15 Use your statistical software package to conduct a one-factor ANOVA to determine if the group means are equal using α=0.01. Though not specifically assessed here, you are encouraged to also test the assumptions, plot the group means, and interpret the results.Group means (report to 2 decimal places):Group 1: Internship: Group 2: Co-op: Group 3: Work Study: ANOVA summary statistics:F-ratio = _______ (report accurate to 3 decimal places)p=_________ (report accurate to 4 decimal places)arrow_forwardThe following three independent random samples are obtained from three normally distributed populations with equal variance. The dependent variable is starting hourly wage, and the groups are the types of position (internship, co-op, work study). Group 1: Internship Group 2: Co-op Group 3: Work Study 10.75 12.5 8.5 9.75 10.25 12.5 11.5 13 15.25 10.75 14.25 14.5 11.25 10.5 14 10.5 11 15 13.75 12.75 11.75 11.5 12.5 15.75 11.75 12.75 12 13.25 13.75 14 12.75 14.25 12.25 Conduct a one-factor ANOVA to determine if the group means are equal using α=0.01α=0.01. Group means:Group 1 mean: Group 2 mean: Group 3 mean: ANOVA summary statistics:F-test statistic = p=p= Conclusion: The sample data suggests there is a correlation in the starting hourly wages. There is not sufficient data to conclude that at least one group's average starting hourly wage is different. The sample data suggests the starting hourly wages are dependent There is not…arrow_forward4 4G I. moodle.unizwa.edu.om a | Quiz3 Time left 0:00:21 Question 3 Answer saved Marked out of 2.00 P Flag question Which one of the following choices describes a problem for which an analysis of variance would be appropriate? O A. Comparing the proportion of successes for three different treatments of anxiety. Each treatment is tried on 100 patients O B. Analyzing the relationship between high school GPA and college GPA O . Analyzing the relationship between gender and opinion about capital punishment (favor or oppose). O D. Comparing the mean birth weights of newborn babies for three different hospitals. O E. None of these Clear my choice Previous page Next page 1 2w-ANOVA(3) Jump to... Quiz navigation 7 +arrow_forward
- The club owner was wondering whether all three comedians (enumerated COMEDIAN 1, 2, and 3) generated the same average ticket (TICKETSOLD) and beverage (BEVSOLD) sales. What do you tell them? You need to figure out the answer to the above question via: Perform the Shapiro-Wilk test of normality and Levene’s (equality of variances) test for TICKETSOLD and BEVSOLD. Write up all tests. Given what you figured out in part (a), which variable(s) may be used in an ANOVA? How do you know? Perform the ANOVA with Tukey HSD post hoc test for variables suitable for an ANOVA. Write up the results. Create a 3-5 sentence response answering the owner’s question. Make sure you integrate the findings from parts (a)-(c) in your response. You may assume the owner possesses a knowledge of statistics equal to your own. The ANOVA Procedure Dependent Variable: VARIABLE Source DF Sum of Squares Mean Square F Value Pr > F Model df…arrow_forwardAnswer the following questions on the F test statistic. Complete parts (a) through (d) below. a. If s represents the larger of two sample variances, can the F test statistic ever be less than 1? O A. No, because the ratio will always be greater than 1. S1 2 $₁ O B. Yes, because the ratio will always be less than 1. $2 1 O C. No, because the ratio will always be greater than 1. $2 2 $2 O D. Yes, because the ratio will always be less than 1. 2 $1 b. Can the F test statistic ever be a negative number? O A. No, because sample variances cannot be negative, and the result of dividing the squares of two nonnegative numbers is never negative. O B. Yes, because the numerator and denominator used to calculate the F test statistic can both take on negative and positive values. O C. No, because sample variances are always negative and the result of dividing the squares of two negative numbers is never negative. OD. Yes, because scan take on values from - 1 to 1 inclusive. c. If testing the claim…arrow_forwardThe following data are from a completely randomized design. In the following calculations, use a = 0.05. Treatment Treatment Treatment 2 3 64 82 69 47 71 53 54 87 60 35 64 46 50 76 57 2 148.67 108.67 96.67arrow_forward
- 5. About 8% of Americans drop out of high school. About 30% of Americans are republicans. Therefore, the probability of someone being both a high school drop out and voting republican is 2.4%. Group of answer choices Correlation does not imply causation Variables aren’t independent (A|B =/= B|A) Highly improbable events tend to get famous There will likely be a self-reporting bias Terrible Survey Design: Biased question Terrible Survey Design: Sampling technique Terrible Survey Design: Small sample sizearrow_forwardWhich of the following is not one of the assumptions made in the analysis of variance? O A. None of these O B. The different populations all have the same mean. O C. The different populations all have the same standard deviation o O D. The distribution of the response variable is a normal. O E. Each sample is an independent random sample.arrow_forward
arrow_back_ios
arrow_forward_ios
Recommended textbooks for you
- MATLAB: An Introduction with ApplicationsStatisticsISBN:9781119256830Author:Amos GilatPublisher:John Wiley & Sons Inc
 Probability and Statistics for Engineering and th...StatisticsISBN:9781305251809Author:Jay L. DevorePublisher:Cengage Learning
 Statistics for The Behavioral Sciences (MindTap C...StatisticsISBN:9781305504912Author:Frederick J Gravetter, Larry B. WallnauPublisher:Cengage Learning
  Elementary Statistics: Picturing the World (7th E...StatisticsISBN:9780134683416Author:Ron Larson, Betsy FarberPublisher:PEARSON
 The Basic Practice of StatisticsStatisticsISBN:9781319042578Author:David S. Moore, William I. Notz, Michael A. FlignerPublisher:W. H. Freeman
 Introduction to the Practice of StatisticsStatisticsISBN:9781319013387Author:David S. Moore, George P. McCabe, Bruce A. CraigPublisher:W. H. Freeman
MATLAB: An Introduction with Applications
Statistics
ISBN:9781119256830
Author:Amos Gilat
Publisher:John Wiley & Sons Inc
Probability and Statistics for Engineering and th...
Statistics
ISBN:9781305251809
Author:Jay L. Devore
Publisher:Cengage Learning
Statistics for The Behavioral Sciences (MindTap C...
Statistics
ISBN:9781305504912
Author:Frederick J Gravetter, Larry B. Wallnau
Publisher:Cengage Learning
Elementary Statistics: Picturing the World (7th E...
Statistics
ISBN:9780134683416
Author:Ron Larson, Betsy Farber
Publisher:PEARSON
The Basic Practice of Statistics
Statistics
ISBN:9781319042578
Author:David S. Moore, William I. Notz, Michael A. Fligner
Publisher:W. H. Freeman
Introduction to the Practice of Statistics
Statistics
ISBN:9781319013387
Author:David S. Moore, George P. McCabe, Bruce A. Craig
Publisher:W. H. Freeman