MATLAB: An Introduction with Applications
6th Edition
ISBN: 9781119256830
Author: Amos Gilat
Publisher: John Wiley & Sons Inc
expand_more
expand_more
format_list_bulleted
Question
19

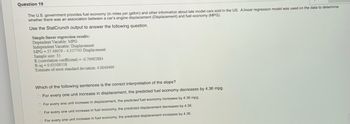
Transcribed Image Text:Question 19
The U.S. government provides fuel economy (in miles per gallon) and other information about late model cars sold in the US. A linear regression model was used on the data to determine
whether there was an association between a car's engine displacement (Displacement) and fuel economy (MPG).
Use the StatCrunch output to answer the following question.
Simple linear regression results:
Dependent Variable: MPG
Independent Variable: Displacement
MPG 37.49079 -4.357743 Displacement
Sample size: 35
R (correlation coefficient)- -0.79692884
R-sq-0.63509558
Estimate of error standard deviation: 4.0040499
Which of the following sentences is the correct interpretation of the slope?
For every one unit increase in displacement, the predicted fuel economy decreases by 4.36 mpg.
For every one unit increase in displacement, the predicted fuel economy increases by 4.36 mpg.
For every one unit increase in fuel economy, the predicted displacement decreases by 4.36.
For every one unit increase in fuel economy, the predicted displacement increases by 4.36.
Expert Solution
arrow_forward
Step 1
The regression equation is given by
MPG = 37.49079 - 4.357743 Displacement
Step by stepSolved in 2 steps

Knowledge Booster
Similar questions
Recommended textbooks for you
 MATLAB: An Introduction with ApplicationsStatisticsISBN:9781119256830Author:Amos GilatPublisher:John Wiley & Sons Inc
 Probability and Statistics for Engineering and th...StatisticsISBN:9781305251809Author:Jay L. DevorePublisher:Cengage Learning
 Statistics for The Behavioral Sciences (MindTap C...StatisticsISBN:9781305504912Author:Frederick J Gravetter, Larry B. WallnauPublisher:Cengage Learning
 Elementary Statistics: Picturing the World (7th E...StatisticsISBN:9780134683416Author:Ron Larson, Betsy FarberPublisher:PEARSON
 The Basic Practice of StatisticsStatisticsISBN:9781319042578Author:David S. Moore, William I. Notz, Michael A. FlignerPublisher:W. H. Freeman
 Introduction to the Practice of StatisticsStatisticsISBN:9781319013387Author:David S. Moore, George P. McCabe, Bruce A. CraigPublisher:W. H. Freeman

MATLAB: An Introduction with Applications
Statistics
ISBN:9781119256830
Author:Amos Gilat
Publisher:John Wiley & Sons Inc

Probability and Statistics for Engineering and th...
Statistics
ISBN:9781305251809
Author:Jay L. Devore
Publisher:Cengage Learning

Statistics for The Behavioral Sciences (MindTap C...
Statistics
ISBN:9781305504912
Author:Frederick J Gravetter, Larry B. Wallnau
Publisher:Cengage Learning

Elementary Statistics: Picturing the World (7th E...
Statistics
ISBN:9780134683416
Author:Ron Larson, Betsy Farber
Publisher:PEARSON

The Basic Practice of Statistics
Statistics
ISBN:9781319042578
Author:David S. Moore, William I. Notz, Michael A. Fligner
Publisher:W. H. Freeman

Introduction to the Practice of Statistics
Statistics
ISBN:9781319013387
Author:David S. Moore, George P. McCabe, Bruce A. Craig
Publisher:W. H. Freeman