
MATLAB: An Introduction with Applications
6th Edition
ISBN: 9781119256830
Author: Amos Gilat
Publisher: John Wiley & Sons Inc
expand_more
expand_more
format_list_bulleted
Related questions
Concept explainers
Question
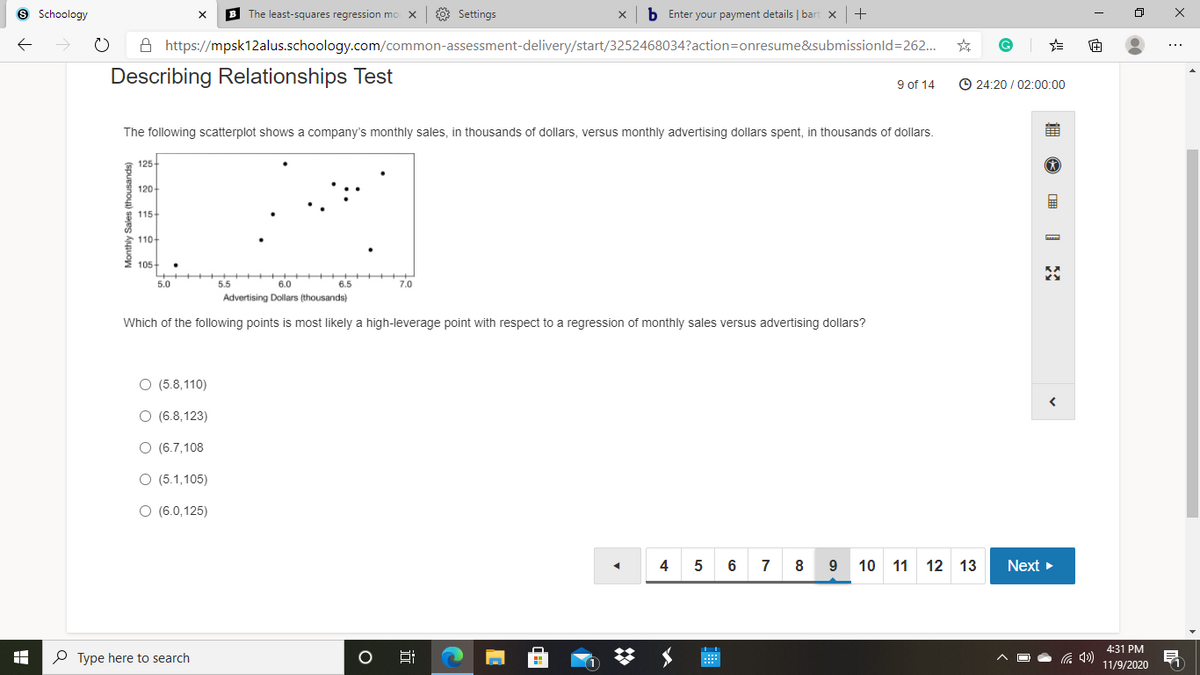
The following scatterplot shows a company’s monthly sales, in thousands of dollars, versus monthly advertising dollars spent, in thousands of dollars.

Transcribed Image Text:9 Schoology
B The least-squares regression mo X
8 Settings
b Enter your payment details | bart x
+
A https://mpsk12alus.schoology.com/common-assessment-delivery/start/3252468034?action=onresume&submissionld=262.
Describing Relationships Test
9 of 14
© 24:20 / 02:00:00
The following scatterplot shows a company's monthly sales, in thousands of dollars, versus monthly advertising dollars spent, in thousands of dollars.
125
120
* 115-
110-
2 105-
5.0
5.5
6.0
6.5
7.0
Advertising Dollars (thousands)
Which of the following points is most likely a high-leverage point with respect to a regression of monthly sales versus advertising dollars?
O (5.8,110)
O (6.8,123)
O (6.7,108
O (5.1,105)
O (6.0,125)
4
6
7
8
9
10 11 12 13
Next >
4:31 PM
P Type here to search
Hi
11/9/2020
Monthly Sales (thousands)
Expert Solution
This question has been solved!
Explore an expertly crafted, step-by-step solution for a thorough understanding of key concepts.

This is a popular solution

Trending nowThis is a popular solution!

Step by stepSolved in 2 steps

Knowledge Booster


Learn more about
Need a deep-dive on the concept behind this application? Look no further. Learn more about this topic, statistics and related others by exploring similar questions and additional content below.Similar questions
- the average annual cost of college at 4 year private college was $29,056 in the 2012-2013 academic year. this was a 4.2% increase from the previous yeararrow_forwardSuppose that you have bought a total of 3200 shares of a stock of a particular company. You bought 1400 shares of stock at $17 per share 700 shares of stock at $12 per share and the remaining shares at $22 per share. What is the average price you paid per share of stock?arrow_forwardIf Amy spends the whole day swimming every Friday, and only Friday, what percentage of her days in a 15-week period are devoted to swimming?arrow_forward
- In 1975, there were about 139 million vehicles (cars and trucks) and about 216 million people inthe United States. The number of vehicles has been growing at 4% per year, while the populationhas been growing at 1% per year. In what year was there, on average, one vehicle per person?arrow_forwardFor three consecutive years the tuition of an university increased by 15%, 11%, and 9%, respectively. What was the overall percentage increase of tuition during the three-year-period?arrow_forwardSuppose 26% of all college students are business majors; 27% of all college students are women; but 10% of business majors are womenWhat percent of college students are female business majors? Round your answer to three decimal places.arrow_forward
arrow_back_ios
arrow_forward_ios
Recommended textbooks for you
- MATLAB: An Introduction with ApplicationsStatisticsISBN:9781119256830Author:Amos GilatPublisher:John Wiley & Sons Inc
 Probability and Statistics for Engineering and th...StatisticsISBN:9781305251809Author:Jay L. DevorePublisher:Cengage Learning
 Statistics for The Behavioral Sciences (MindTap C...StatisticsISBN:9781305504912Author:Frederick J Gravetter, Larry B. WallnauPublisher:Cengage Learning
  Elementary Statistics: Picturing the World (7th E...StatisticsISBN:9780134683416Author:Ron Larson, Betsy FarberPublisher:PEARSON
 The Basic Practice of StatisticsStatisticsISBN:9781319042578Author:David S. Moore, William I. Notz, Michael A. FlignerPublisher:W. H. Freeman
 Introduction to the Practice of StatisticsStatisticsISBN:9781319013387Author:David S. Moore, George P. McCabe, Bruce A. CraigPublisher:W. H. Freeman
MATLAB: An Introduction with Applications
Statistics
ISBN:9781119256830
Author:Amos Gilat
Publisher:John Wiley & Sons Inc
Probability and Statistics for Engineering and th...
Statistics
ISBN:9781305251809
Author:Jay L. Devore
Publisher:Cengage Learning
Statistics for The Behavioral Sciences (MindTap C...
Statistics
ISBN:9781305504912
Author:Frederick J Gravetter, Larry B. Wallnau
Publisher:Cengage Learning
Elementary Statistics: Picturing the World (7th E...
Statistics
ISBN:9780134683416
Author:Ron Larson, Betsy Farber
Publisher:PEARSON
The Basic Practice of Statistics
Statistics
ISBN:9781319042578
Author:David S. Moore, William I. Notz, Michael A. Fligner
Publisher:W. H. Freeman
Introduction to the Practice of Statistics
Statistics
ISBN:9781319013387
Author:David S. Moore, George P. McCabe, Bruce A. Craig
Publisher:W. H. Freeman