ENGR.ECONOMIC ANALYSIS
14th Edition
ISBN: 9780190931919
Author: NEWNAN
Publisher: Oxford University Press
expand_more
expand_more
format_list_bulleted
Question

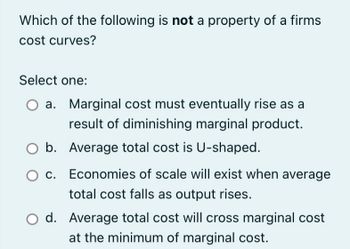
Transcribed Image Text:Which of the following is not a property of a firms
cost curves?
Select one:
a.
O b.
O c.
Marginal cost must eventually rise as a
result of diminishing marginal product.
Average total cost is U-shaped.
Economies of scale will exist when average
total cost falls as output rises.
d. Average total cost will cross marginal cost
at the minimum of marginal cost.

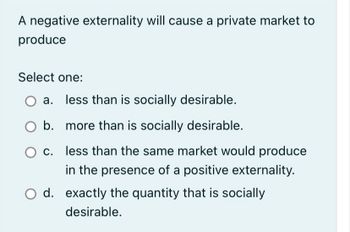
Transcribed Image Text:A negative externality will cause a private market to
produce
Select one:
a. less than is socially desirable.
O b. more than is socially desirable.
c.
less than the same market would produce
in the presence of a positive externality.
O d. exactly the quantity that is socially
desirable.
Expert Solution
This question has been solved!
Explore an expertly crafted, step-by-step solution for a thorough understanding of key concepts.
This is a popular solution
Trending nowThis is a popular solution!
Step by stepSolved in 2 steps

Knowledge Booster
Learn more about
Need a deep-dive on the concept behind this application? Look no further. Learn more about this topic, economics and related others by exploring similar questions and additional content below.Similar questions
- The N.M. Corporation has exactly the same costs of production as last year except for fixed costs, which are $50,000 this year compared to $30,000 last year. Which of the following statements is false? O The total cost curve will be the same this year as last year. O The fixed cost curve will have the same slope this year as last year. O The variable cost curve will be the same this year as last year. O The marginal cost curve will be the same this year as last year.arrow_forwardCost LRAC B A Quantity Figure 1 Long run average cost curve for a firm Figure 1 shows a long run average cost curve for a firm. If the firm increases output from point A to point B this is an example of: Select one: O i. A change in production function O ii. Economies of scale iii. Constant unit cost O iv. Diseconomies of scalearrow_forwardSuppose there are fixed costs and the marginal costs are constant. Then we know that Select one: a. average variable costs decrease continuously as output increases and lie above the marginal cost curve. cross out O O b. average total costs decrease continuously as output increases but always lie above the average variable cost curve which is constant. cross out c. average total costs are constant. X d. average total costs decrease continuously as output increases and lies above the average variable cost curve which is also decreasing continuously as output increases. cross out cross outarrow_forward
- The figure at right illustrates short-run cost curves for a firm. Based on this figure, which of the following is true? O A. A is the total cost curve, B is the marginal cost curve, and C is the total fixed cost curve. O B. A is the average variable cost curve, B is the total fixed cost curve, and C is the average total cost curve. O C. A is the total cost curve, B is the total variable cost curve, and C is the total fixed cost curve. O D. A is the total cost curve, B is the total variable cost curve, and C is the marginal cost curve. O E. A is the average variable cost curve, B is the average total cost curve, and C is the marginal cost curve. Quantity сarrow_forwardBob produces candles. The average total cost reaches its minimum at a quantity O A. the same as the quantity at which the average variable cost reaches its minimum. O B. lower than the quantity at which the average variable cost reaches its minimum. O C. the same as the quantity at which the marginal cost is at a maximum. O D. the same as the quantity at which the marginal cost is at a minimum. O E. greater than the quantity at which the average variable cost reaches its minimum.arrow_forwardWhat are diseconomies of scale? Diseconomies of scale is A. when the marginal product of labor is decreasing with output. B. when the marginal cost of production is increasingwith output. C. when a firm's long-run average costs decrease with output. D. when a firm's long-run average costs increase with output.arrow_forward
- Solve for the missing entries in the above table. Enter whole dollar values for Total and Marginal Cost calculations. Round all average cost calculations to the nearest cent. Enter your answers in the following format: A. $5 B. $18 C. $40 etc. (Note, this is just an example, these are NOT the correct answers.)arrow_forwardConsider the three figures below, depicting possible cost functions for a firm. The horizontal axis measures output in all figures, while the vertical axis measures dollars. A B Which of the following statements are correct? Choose one or more: ⒸA. Figure A could represent the average total cost. OB. Figure B could represent the average total cost. C. Figure C could represent the average total cost. OD. If Figure B represents the average variable cost, then Figure C could not represent the average total cost. OE. If Figure B represents the marginal cost, then Figure C cannot represent the average total cost.arrow_forwardWhen a firm produces one unit, the variable cost is $7. When the firm produces two units, the variable cost is $10. When the firm produces three units, the variable cost is $12. What is the marginal cost associated with three units of production? Select one: O a. 3 O b. 7 O c. 2 O d. 0arrow_forward
- S 90 70 40 30 50 MC 100 ATC AVC Figure shows a firm's marginal cost, average total cost, and average variable cost curves. When Q = 50, the total cost will be: O A. $2,800. O B. $4,500. O C. $6.300. O D. $2,100.arrow_forwardA firm has a fixed production cost of $1,000 and a constant marginal cost of production of $700 per unit produced. What is the firm's total cost function? O A. TC = 1,000 + (700q) O B. TC = 1,000 + (700q). OC. TC = 700q. O D. TC = 1,000. The firm's average total cost (ATC) of production is O A. ATC = 1,000 + (700q). OB. 1,000 + (700q) ATC = Oc. 1,000 ATC = O D. ATC = 700q. O E. ATC = 700. If the firm wanted to minimize the average total cost, would it choose to be very large or very small? Explain. OA. very small because the average total cost of production rises with output. O B.- very large because the average variable cost of production falls with output. OC. very small because the average fixed cost of production rises with output. O D. very small because the total cost of production rises with output. O E. very large because the average total cost of production falls with output.arrow_forwardPlease answer both and give explanation of correct and incorrect options and get likearrow_forward
arrow_back_ios
arrow_forward_ios
Recommended textbooks for you

 Principles of Economics (12th Edition)EconomicsISBN:9780134078779Author:Karl E. Case, Ray C. Fair, Sharon E. OsterPublisher:PEARSON
 Engineering Economy (17th Edition)EconomicsISBN:9780134870069Author:William G. Sullivan, Elin M. Wicks, C. Patrick KoellingPublisher:PEARSON
 Principles of Economics (MindTap Course List)EconomicsISBN:9781305585126Author:N. Gregory MankiwPublisher:Cengage Learning
 Managerial Economics: A Problem Solving ApproachEconomicsISBN:9781337106665Author:Luke M. Froeb, Brian T. McCann, Michael R. Ward, Mike ShorPublisher:Cengage Learning
 Managerial Economics & Business Strategy (Mcgraw-...EconomicsISBN:9781259290619Author:Michael Baye, Jeff PrincePublisher:McGraw-Hill Education


Principles of Economics (12th Edition)
Economics
ISBN:9780134078779
Author:Karl E. Case, Ray C. Fair, Sharon E. Oster
Publisher:PEARSON

Engineering Economy (17th Edition)
Economics
ISBN:9780134870069
Author:William G. Sullivan, Elin M. Wicks, C. Patrick Koelling
Publisher:PEARSON

Principles of Economics (MindTap Course List)
Economics
ISBN:9781305585126
Author:N. Gregory Mankiw
Publisher:Cengage Learning

Managerial Economics: A Problem Solving Approach
Economics
ISBN:9781337106665
Author:Luke M. Froeb, Brian T. McCann, Michael R. Ward, Mike Shor
Publisher:Cengage Learning

Managerial Economics & Business Strategy (Mcgraw-...
Economics
ISBN:9781259290619
Author:Michael Baye, Jeff Prince
Publisher:McGraw-Hill Education