Calculus: Early Transcendentals
8th Edition
ISBN: 9781285741550
Author: James Stewart
Publisher: Cengage Learning
expand_more
expand_more
format_list_bulleted
Question

Transcribed Image Text:**Question:**
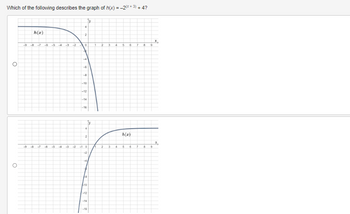
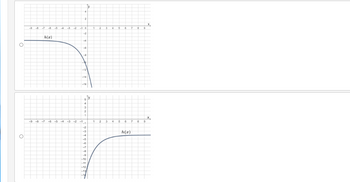
Which of the following describes the graph of \( h(x) = -2^{(x-3)} + 4 \)?
**Graphs:**
1. **First Graph:**
- The graph consists of a curve that starts from the top-left corner, decreasing rapidly as it moves to the right.
- It shows a near-vertical descent and gradually flattens out as it approaches \( y = -16 \) at \( x = 9 \).
- The curve closely follows the y-axis below before turning towards the right.
2. **Second Graph:**
- The graph begins from the bottom-left corner and moves upwards to the right.
- Initially, the curve rises steeply and then starts to flatten out as it progresses rightwards.
- The curve approaches but does not appear to cross \( y = 4 \) as it continues to move to the right. This suggests a horizontal asymptote at \( y = 4 \).
- The graph levels off near \( y = 4 \) as \( x \) moves beyond \( 9 \), exemplifying the behavior of the exponential function \( -2^{(x-3)} + 4 \).
**Explanation:**
The graphs provided are to be analyzed to determine which one correctly represents the function \( h(x) = -2^{(x-3)} + 4 \). The second graph suits the characteristics of this exponential function since it reflects the behavior expected — rapidly increasing and asymptotically approaching \( y = 4 \) from below.

Transcribed Image Text:The image contains two graphs, each displaying a function \( h(x) \).
#### First Graph (Top):
- **Axes**:
- The horizontal axis (x-axis) ranges from -9 to 9.
- The vertical axis (y-axis) ranges from -16 to 2.
- **Function**: \( h(x) \)
- **Behavior**:
- As \( x \) increases from left to right, the value of \( h(x) \) decreases sharply, continuing into the negative \( y \) values.
- The graph appears to taper off more sharply as \( x \) becomes more positive, suggesting a steep decline.
#### Second Graph (Bottom):
- **Axes**:
- The horizontal axis (x-axis) ranges from -9 to 9.
- The vertical axis (y-axis) ranges from -16 to 2.
- **Function**: \( h(x) \)
- **Behavior**:
- As \( x \) increases from left to right, the value of \( h(x) \) increases sharply from large negative \( y \) values to higher \( y \) values.
- The graph shows a steep incline as \( x \) becomes more positive.
### Comparison:
- Both graphs feature the same function, \( h(x) \), observed over a consistent range for \( x \) and \( y \) values.
### Purpose:
These graphs can be used to illustrate different behaviors of a mathematical function, such as exponential decay in the first graph and exponential growth in the second graph. They serve as excellent visuals for understanding how function transformations reflect over the y-axis or around different points.
Expert Solution
This question has been solved!
Explore an expertly crafted, step-by-step solution for a thorough understanding of key concepts.
This is a popular solution
Trending nowThis is a popular solution!
Step by stepSolved in 2 steps with 2 images

Knowledge Booster
Similar questions
- Draw the graph of f(x) = 2+¹ 10 -9 -8 -7 -6 -5 -4 -3 -2 -1 Clear All Draw: 10 9 8 7 6 5 4 3 2 1 J 7 2 -3 -4 -5 -6 -7 -8 -9 -10 7 2 I 3 4 5 6 7 8 9 10arrow_forwardUse the graph below to answer the following questions: 5- 4- 3- -5 -4 -3 -2 4 -1 =1 3 5 -2 -3- -4 -5- 1 f(x) 3 x – 2 1) As x → 2- , f(x) → 2) As x → 2+, f(x) → 3) As x → - 0, f(x) – 4) As x → , f(x) →arrow_forward(d) Graph f(x) = 9x on the window [-9, 9] by [-9, 9]. Do you see why the slope at x = 0 does not exist? O -5 y 5 -5 10 5 -5 -10 5 5 X @ O -5 10 y 5 5 5 Xarrow_forward
Recommended textbooks for you
 Calculus: Early TranscendentalsCalculusISBN:9781285741550Author:James StewartPublisher:Cengage Learning
 Thomas' Calculus (14th Edition)CalculusISBN:9780134438986Author:Joel R. Hass, Christopher E. Heil, Maurice D. WeirPublisher:PEARSON
 Calculus: Early Transcendentals (3rd Edition)CalculusISBN:9780134763644Author:William L. Briggs, Lyle Cochran, Bernard Gillett, Eric SchulzPublisher:PEARSON
 Calculus: Early TranscendentalsCalculusISBN:9781319050740Author:Jon Rogawski, Colin Adams, Robert FranzosaPublisher:W. H. Freeman
 Calculus: Early Transcendental FunctionsCalculusISBN:9781337552516Author:Ron Larson, Bruce H. EdwardsPublisher:Cengage Learning

Calculus: Early Transcendentals
Calculus
ISBN:9781285741550
Author:James Stewart
Publisher:Cengage Learning

Thomas' Calculus (14th Edition)
Calculus
ISBN:9780134438986
Author:Joel R. Hass, Christopher E. Heil, Maurice D. Weir
Publisher:PEARSON

Calculus: Early Transcendentals (3rd Edition)
Calculus
ISBN:9780134763644
Author:William L. Briggs, Lyle Cochran, Bernard Gillett, Eric Schulz
Publisher:PEARSON

Calculus: Early Transcendentals
Calculus
ISBN:9781319050740
Author:Jon Rogawski, Colin Adams, Robert Franzosa
Publisher:W. H. Freeman


Calculus: Early Transcendental Functions
Calculus
ISBN:9781337552516
Author:Ron Larson, Bruce H. Edwards
Publisher:Cengage Learning