
MATLAB: An Introduction with Applications
6th Edition
ISBN: 9781119256830
Author: Amos Gilat
Publisher: John Wiley & Sons Inc
expand_more
expand_more
format_list_bulleted
Related questions
Question

Transcribed Image Text:10
ved
of
flag
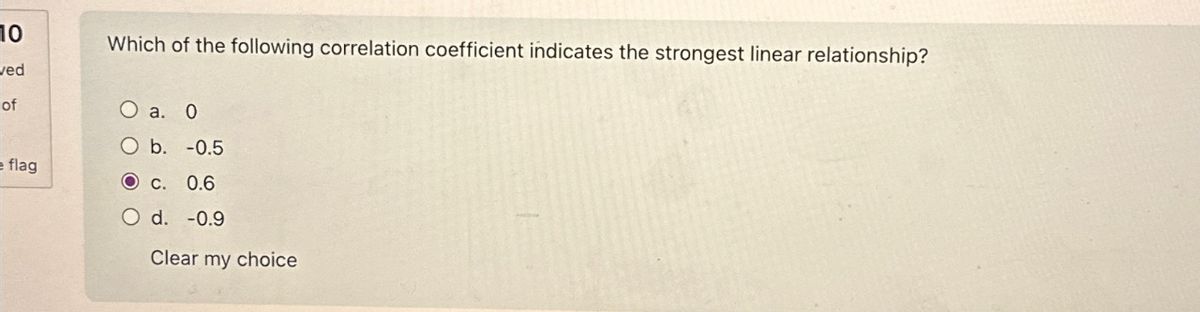
Which of the following correlation coefficient indicates the strongest linear relationship?
O a. 0
O b. -0.5
O c. 0.6
O d. -0.9
Clear my choice
Expert Solution
This question has been solved!
Explore an expertly crafted, step-by-step solution for a thorough understanding of key concepts.

Step by stepSolved in 3 steps

Knowledge Booster

Similar questions
- Match the correlation coefficients with their scatterplots. Select the letter of the scatterplot below which corresponds to the correlation coefficient. (Click on image for a larger view.) B < 1. r = -0.49 A 2. r = 0.97 D ✓ 3. r = 0.22 4. r = -0.74 A B Darrow_forwardWhich number below is representative of the largest correlation? r = -0.75 r = .05 r = -0.45 r = 0.65arrow_forwardWhich of the following correlations indicates the strongest relationship or association and why? r = .10; r = .03; r = -.35; r = -15arrow_forward
- Use the following to answer the question: ŷ : = −3x + 13.9 with R² = 34%. Which best describes the correlation? No linear relationship Weak positive linear relationship O Moderate negative linear relationship O Moderate positive linear relationship Weak negative linear relationshiparrow_forwardBelow shows the linear relationship between first year college GPA and high school GPA For both variables the GPA ranges from 0 to 4 in this sample. However, for the high schools sampled in this region, the true range of GPA is 0 to 5, how might this affect the correlation between these two variables?arrow_forward
arrow_back_ios
arrow_forward_ios
Recommended textbooks for you
- MATLAB: An Introduction with ApplicationsStatisticsISBN:9781119256830Author:Amos GilatPublisher:John Wiley & Sons Inc
 Probability and Statistics for Engineering and th...StatisticsISBN:9781305251809Author:Jay L. DevorePublisher:Cengage Learning
 Statistics for The Behavioral Sciences (MindTap C...StatisticsISBN:9781305504912Author:Frederick J Gravetter, Larry B. WallnauPublisher:Cengage Learning
  Elementary Statistics: Picturing the World (7th E...StatisticsISBN:9780134683416Author:Ron Larson, Betsy FarberPublisher:PEARSON
 The Basic Practice of StatisticsStatisticsISBN:9781319042578Author:David S. Moore, William I. Notz, Michael A. FlignerPublisher:W. H. Freeman
 Introduction to the Practice of StatisticsStatisticsISBN:9781319013387Author:David S. Moore, George P. McCabe, Bruce A. CraigPublisher:W. H. Freeman
MATLAB: An Introduction with Applications
Statistics
ISBN:9781119256830
Author:Amos Gilat
Publisher:John Wiley & Sons Inc
Probability and Statistics for Engineering and th...
Statistics
ISBN:9781305251809
Author:Jay L. Devore
Publisher:Cengage Learning
Statistics for The Behavioral Sciences (MindTap C...
Statistics
ISBN:9781305504912
Author:Frederick J Gravetter, Larry B. Wallnau
Publisher:Cengage Learning
Elementary Statistics: Picturing the World (7th E...
Statistics
ISBN:9780134683416
Author:Ron Larson, Betsy Farber
Publisher:PEARSON
The Basic Practice of Statistics
Statistics
ISBN:9781319042578
Author:David S. Moore, William I. Notz, Michael A. Fligner
Publisher:W. H. Freeman
Introduction to the Practice of Statistics
Statistics
ISBN:9781319013387
Author:David S. Moore, George P. McCabe, Bruce A. Craig
Publisher:W. H. Freeman