
MATLAB: An Introduction with Applications
6th Edition
ISBN: 9781119256830
Author: Amos Gilat
Publisher: John Wiley & Sons Inc
expand_more
expand_more
format_list_bulleted
Related questions
Question
Question 2
If price is $5 and income is $15, what is price elasticity? (Round your answer to two decimal places. If you answer is a number between -1 and 1, please do not omit the zero in the front. For example, you should have your answer as -0.46 instead of -.46).
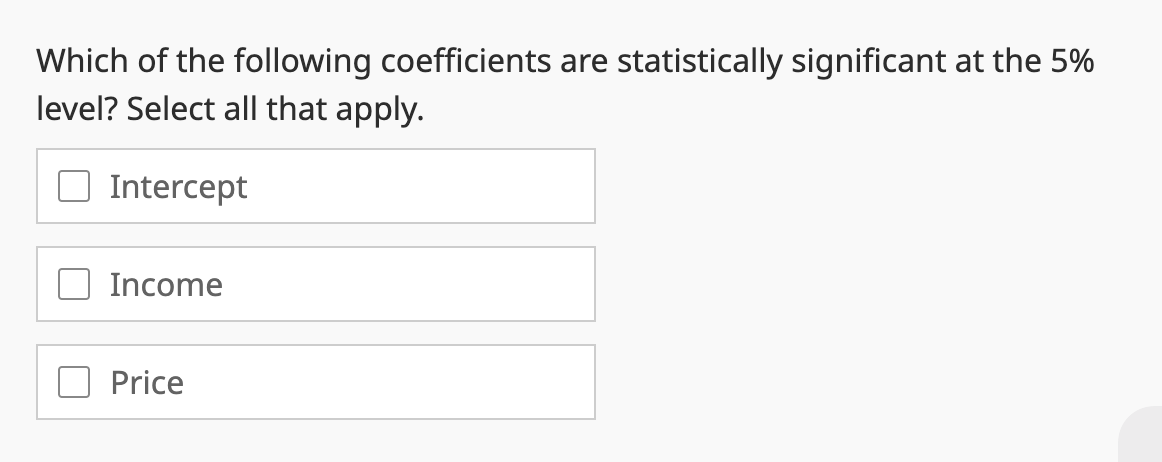

Transcribed Image Text:Which of the following coefficients are statistically significant at the 5%
level? Select all that apply.
Intercept
Income
Price

Transcribed Image Text:An analyst from your firm used a linear demand specification to estimate
the demand for its product
and sent you a hard copy of the results:
SUMMARY OUTPUT
Regression Statistics
Multiple R
R Square
Adjusted R Square
Standard Error
Observations
ANOVA
Regression
Residual
Total
Intercept
Income
Price
0.06735
0.00454
-0.00224
44.03878
297
df
2.00
294.00
296.00
SS
78.26
0.75
-1.86
2597.84
570187.72
572785.56
Coefficients Standard Error
7.00
1.47
1.77
MS
1298.92
1939.41
t Stat
11.18
0.51
-1.05
F
0.67
P-value
0.00
0.61
0.29
Significance F
0.51
Lower 95%
64.49
-2.15
-5.33
Upper 95%
92.04
3.65
1.62
Lower 95.0% Upper 95.0%
64.49
92.04
-2.15
3.65
-5.33
1.62
Expert Solution
This question has been solved!
Explore an expertly crafted, step-by-step solution for a thorough understanding of key concepts.

This is a popular solution

Trending nowThis is a popular solution!

Step by stepSolved in 3 steps

Knowledge Booster

Similar questions
- If you receive a 5% pay raise and then a 5% pay cut is your salary the same? Why or why not? Demonstrate your answer using actual valuesarrow_forwardDetermine whether the statement given below makes sense or does not make sense, and explain your reasoning : "For each $1 increase in the price of a $300 plane ticket, an airline will lose 60 passengers, so if the ticket price is increased to $x, the decrease in passengers is modeled by 60(300 – x)."arrow_forwardLast month a retailer sold 120 jar candles at $30 per candle. This month the retailer is considering putting the candles on sale. They estimate that for each $2 decrease in price, they will sell 10 additonal candles. Find the domain and range in the context of this situationarrow_forward
- please help with the two.arrow_forwardAdam’s parents decided to put money in bank every month for his studies. They started with $100 and decided to double it every 6 months. Determine if the relation is linear, quadratic or exponential. Explain your reasoning. Show your work. Write an equation which models the above relation. How much they will have in the account after 5 years. How long will it take for them to have $5000 in the account.arrow_forward5. Assume food prices have risen about 4% per year for the last five years. a. If a gallon of milk cost $2 five years ago, what does it cost today? b. If a gallon of milk cost Sx five years ago, write an expression for its cost today. c. If a gallon of milk costs $3.50 now, what did it cost five years ago? Write and solve an equation to answer the question. Let x cost of a gallon of milk five years ago d. Ifmilk prices increase 4% per year for five years, what is the overall percent ncreasearrow_forwardIf the cost of college tuition in 2010 was $6015 and in 2014 was $9139, then the average rate of change in tuition during this time period was $781/year. Do you agree or disagree?arrow_forwardPeople who live in Cape Carmel major reasons for their worry is that there are many homes built at, or nearly at, sea level along the coast of Cape Carmel. The total value of these homes is more than 100 million dollars. Ice melting increases the sea level. Global sea level is measured relative to the sea level in the year 1870. If the sea level in 1870 is represented by 0 inches, then Cape Carmel sea level has risen from 1 6.8 inches to 8.4 inches in the years from 1992 to 2012. If the sea level rises to 24 inches, it will have devastating effects on the homes along the coast of Cape Carmel. Many of the Cape Carmel residents want to know if, and when, they should sell their property before it is washed away into the sea. You must help residents understand more about the rising sea level in Cape Carmel to help them predict when they should sell their homes. 11.Create a graph (carefully scaled by hand, or on Excel) that shows BOTH the linear and the exponential model over ALL of the…arrow_forwardA printer that costs dollars is discounted by 40% of the original price. There is an 870 sales tax on the final price. What TWO equivalent expressions show the final price of the printer and correct explanations? A 1.08 (x – 0.40x) because the sales tax is multiplied by the original price and then the amount of the discount is subtracted. B 1.08 (x – 0.40x) because the sales tax is multiplied by the final price after the discount. C. 0.432x because the original price with sales tax is subtracted from the amount of the discounted price with sales tax. D 1.08a 0.40x because the sales tax is multiplied by the original price and then the amount of the discount is subtracted. 1.08x 0.432x because the original price with sales tax is subtracted from the amount of the discounted price with sales tax. B.arrow_forwardarrow_back_iosarrow_forward_ios
Recommended textbooks for you
- MATLAB: An Introduction with ApplicationsStatisticsISBN:9781119256830Author:Amos GilatPublisher:John Wiley & Sons Inc
 Probability and Statistics for Engineering and th...StatisticsISBN:9781305251809Author:Jay L. DevorePublisher:Cengage Learning
 Statistics for The Behavioral Sciences (MindTap C...StatisticsISBN:9781305504912Author:Frederick J Gravetter, Larry B. WallnauPublisher:Cengage Learning
  Elementary Statistics: Picturing the World (7th E...StatisticsISBN:9780134683416Author:Ron Larson, Betsy FarberPublisher:PEARSON
 The Basic Practice of StatisticsStatisticsISBN:9781319042578Author:David S. Moore, William I. Notz, Michael A. FlignerPublisher:W. H. Freeman
 Introduction to the Practice of StatisticsStatisticsISBN:9781319013387Author:David S. Moore, George P. McCabe, Bruce A. CraigPublisher:W. H. Freeman
MATLAB: An Introduction with Applications
Statistics
ISBN:9781119256830
Author:Amos Gilat
Publisher:John Wiley & Sons Inc
Probability and Statistics for Engineering and th...
Statistics
ISBN:9781305251809
Author:Jay L. Devore
Publisher:Cengage Learning
Statistics for The Behavioral Sciences (MindTap C...
Statistics
ISBN:9781305504912
Author:Frederick J Gravetter, Larry B. Wallnau
Publisher:Cengage Learning
Elementary Statistics: Picturing the World (7th E...
Statistics
ISBN:9780134683416
Author:Ron Larson, Betsy Farber
Publisher:PEARSON
The Basic Practice of Statistics
Statistics
ISBN:9781319042578
Author:David S. Moore, William I. Notz, Michael A. Fligner
Publisher:W. H. Freeman
Introduction to the Practice of Statistics
Statistics
ISBN:9781319013387
Author:David S. Moore, George P. McCabe, Bruce A. Craig
Publisher:W. H. Freeman