
Advanced Engineering Mathematics
10th Edition
ISBN: 9780470458365
Author: Erwin Kreyszig
Publisher: Wiley, John & Sons, Incorporated
expand_more
expand_more
format_list_bulleted
Related questions
Question
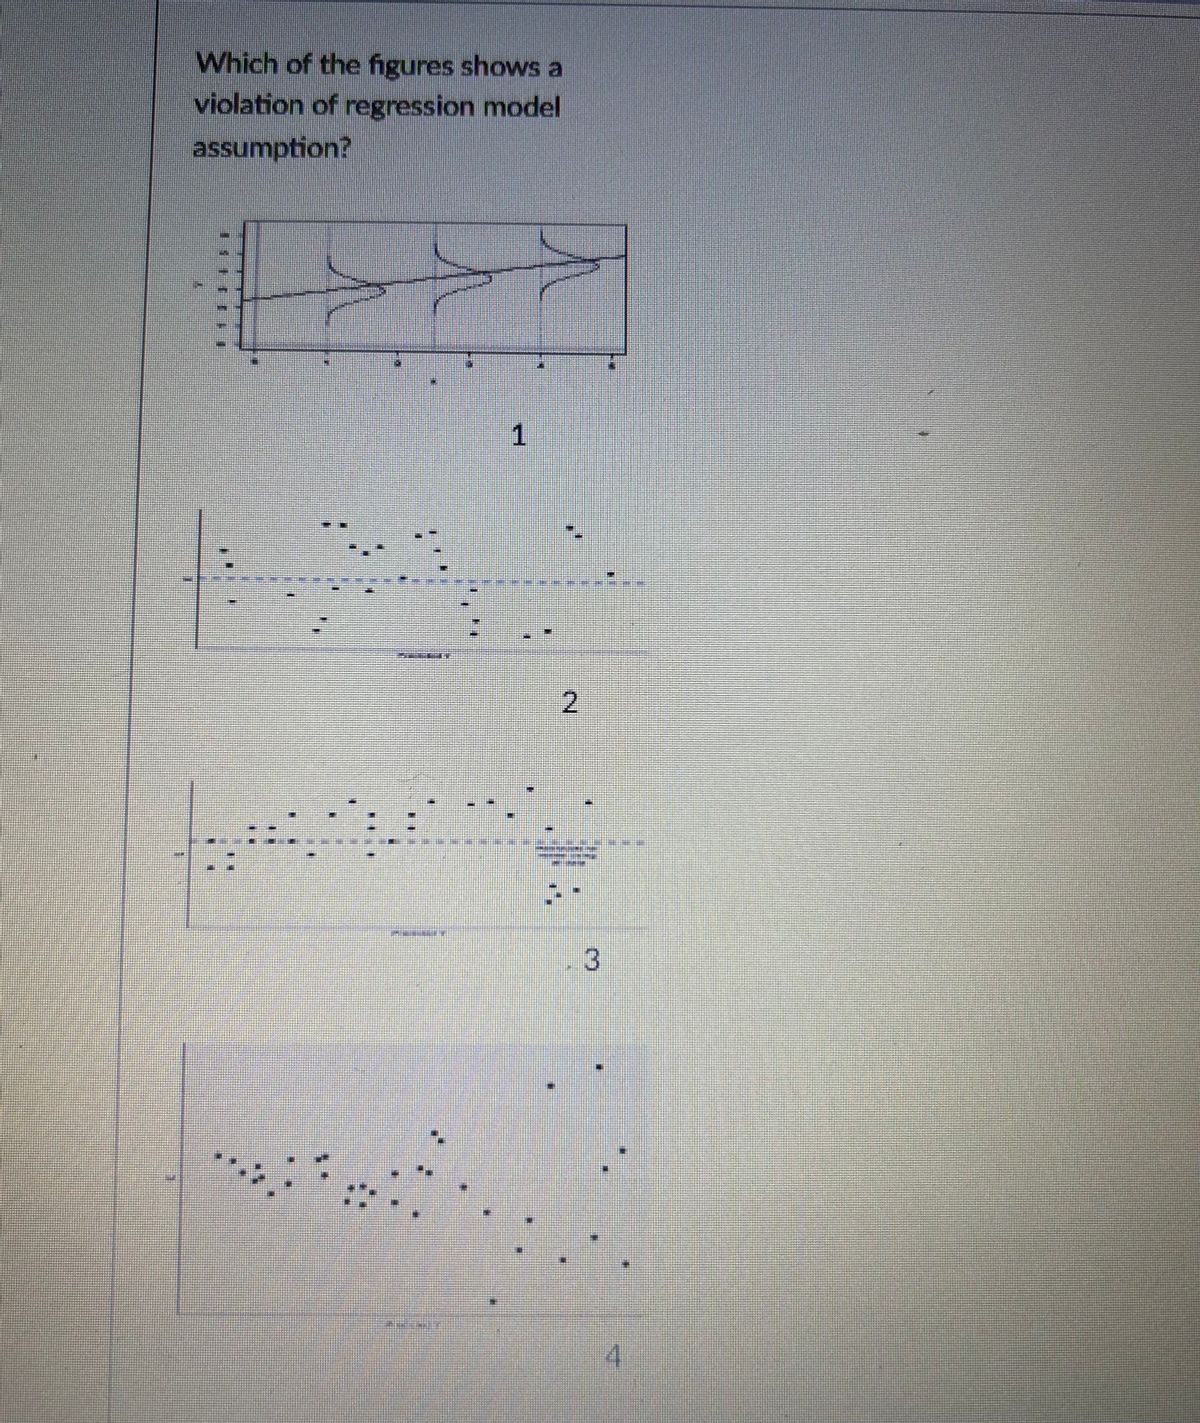

Transcribed Image Text:Which of the figures shows a
violation of regression model
assumption?
1
2
3
4
Expert Solution
This question has been solved!
Explore an expertly crafted, step-by-step solution for a thorough understanding of key concepts.

Step by stepSolved in 2 steps

Knowledge Booster

Similar questions
- What are the assumptions of multiple linear regressions only?arrow_forwardUse Excel to find an estimated linear regression equation using X1 and X2 as the independent variables and Y as the dependent. Put your output on a fresh sheet. Then answer the following questions (excel chart in the picture) Write down the estimates regression equation What is the expected value of Y if X1 is 240 and X2 is 290? Show your calculation at a 5%level of significance, are the true coefficients of X1 and X2 different from zero? Justify briefly using numbers from your excel output. 4. Using Excel, determine a 97% confidence interval for the true coefficient of X1arrow_forwardWe wants to assess the relationship between overall GPA (4.0 scale) and amount of time spent weekly on school work of 50 college students. Simple linear regression model is used and some results for the model is given: a) Is it plausible that the true intercept for the model is 2.0? Why or why not? (hint: using interval for intercept) b) If 2.0 is the real intercept for the model, does it make contextual sense? Explain why it is or why it is not. c) Using the model, calculate the number of hours needed to achieve a GPA of 4.0. Then explain why this estimate number of hours is biased. (hint: think about Y).arrow_forward
- The city wants to further develop the model to include the weather conditions of rainy, cloudy, or sunny. Ice Rink Attendance Temperature (°F) Weather Condition 140 45 Sunny 110 40 Cloudy 135 50 Cloudy 120 40 Cloudy 165 45 Sunny 180 45 Sunny 210 50 Sunny 190 45 Cloudy 170 40 Cloudy 130 45 Rainy 140 45 Cloudy 80 35 Rainy 120 45 Cloudy 100 45 Rainy What is the regression equation? Use the equation to forecast ice rink attendance if the temperature is 38°F and sunny. Should you keep weather condition in the model?arrow_forwardAutomobile racing, high-performance driving schools, and driver education programs run by automobile clubs continue to grow in popularity. All these activities require the participant to wear a helmet that is certified by the Snell Memorial Foundation, a not-for-profit organization dedicated to research, education, testing, and development of helmet safety standards. Snel| "SA" (Sports Application) rated professional helmets are designed for auto racing and provide extreme impact resistance and high fire protection. One of the key factors in selecting a helmet is weight, since lower weight helmets tend to place less stress on the neck. The following data show the weight and price for 18 SA helmets (SoloRacer website). Helmet Weight (oz) Price ($) Pyrotect Pro Airflow 64 241 Pyrotect Pro Airflow Graphics 64 276 RCi Full Face 64 202 RaceQuip RidgeLine 64 197 HJC AR-10 58 291 HJC Si-12 47 708 HJC HX-10 49 910 Impact Racing Super Sport 59 331 Zamp FSA-1 66 197 Zamp RZ-2 58 292 Zamp RZ-2…arrow_forwardWhat is the null hypothesis to test the significance of the slope in a regression equation? Multiple Choice Ho:B 20 Ho: Bs0 O Ho: B = 0 Ho: B 0arrow_forward
- 1.)fill in the blanks. Based on the physician's study, the predictor variable, X is_____and the response variable, Y, is________. 2.) As described in the article, the relation between age and peak heart is a______. - positive relation - negative relation - no relation 3.) Provide the regression line, ŷ=a+bx. Show steps/equations used to get answer. 4.) Suppose a 40 year old person is randomely selected. Use your Model to predict their peak heart rate. 5.) Based on your model, as a person ages one year, how much would you expect peak heart rate to change?arrow_forward1.1 Find the chawnteristic equation and Hhe eigonanlacs Cand bais for each matrisx. of the corres pun ding eigenspares) of the -3 -4 4 -18 The charar feristic equation ® the eigenvalues (enter your auswer from smallest to langut.) (21, do, ag )= (C a bais for eah He conpeponting igonsparce. X, = D X3 =arrow_forwardThe following table shows worldwide sales and projected sales of a certain type of phone and their average selling prices in 2020, 2022, and 2024. Year 2020 2022 2024 Selling Price ($100) p 6 5 4.5 Sales (billions) q 1 1.2 1.3 Find the regression line. 9(p) = Use the regression line to estimate the demand (in millions of units sold) when the selling price was $250. X million 1.6 Need Help? Read It Master Itarrow_forward
- Interpret the regression results.arrow_forwardExplain how to find searrow_forward1ee 19 20 21 22 23 24 25 Price ars) QUESTION 6 A medical rescarcher found a significant relationship among a person's age x, chloresterol level x2, sodium level of the blood x3, and systolic blood pressure y. The regression equation is 97.3+0.700x+21&-299x3, Predict the systolic blood pressure of someone who is 31 years old and has a chloresterol level of 195 milligrares per deciliter and a sodium blood level of 142 milliequivalents per liter. O 171 O-24 O 128 O 85,087 QUESTION 7 MacBook Air SO DII F3 FS F6 & 4 W R T Y D H K Varrow_forward
arrow_back_ios
SEE MORE QUESTIONS
arrow_forward_ios
Recommended textbooks for you
- Advanced Engineering MathematicsAdvanced MathISBN:9780470458365Author:Erwin KreyszigPublisher:Wiley, John & Sons, Incorporated
 Numerical Methods for EngineersAdvanced MathISBN:9780073397924Author:Steven C. Chapra Dr., Raymond P. CanalePublisher:McGraw-Hill Education
 Introductory Mathematics for Engineering Applicat...Advanced MathISBN:9781118141809Author:Nathan KlingbeilPublisher:WILEY
  Mathematics For Machine TechnologyAdvanced MathISBN:9781337798310Author:Peterson, John.Publisher:Cengage Learning,

Advanced Engineering Mathematics
Advanced Math
ISBN:9780470458365
Author:Erwin Kreyszig
Publisher:Wiley, John & Sons, Incorporated
Numerical Methods for Engineers
Advanced Math
ISBN:9780073397924
Author:Steven C. Chapra Dr., Raymond P. Canale
Publisher:McGraw-Hill Education
Introductory Mathematics for Engineering Applicat...
Advanced Math
ISBN:9781118141809
Author:Nathan Klingbeil
Publisher:WILEY
Mathematics For Machine Technology
Advanced Math
ISBN:9781337798310
Author:Peterson, John.
Publisher:Cengage Learning,