Algebra and Trigonometry (6th Edition)
6th Edition
ISBN: 9780134463216
Author: Robert F. Blitzer
Publisher: PEARSON
expand_more
expand_more
format_list_bulleted
Concept explainers
Question

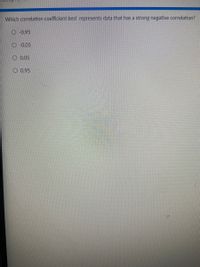
Transcribed Image Text:Which correlation coefficient best represents data that has a strong negative correlation?
-0.95
O 0.05
0.05
O 0.95
Expert Solution
This question has been solved!
Explore an expertly crafted, step-by-step solution for a thorough understanding of key concepts.
This is a popular solution
Trending nowThis is a popular solution!
Step by stepSolved in 2 steps with 2 images

Knowledge Booster
Learn more about
Need a deep-dive on the concept behind this application? Look no further. Learn more about this topic, algebra and related others by exploring similar questions and additional content below.Similar questions
- 36 Which is the strongest (highest) r correlation: -0.9000 -0.6000 -0.3000 0.4500arrow_forwardA researcher wants to assess the relationship between the number of training sessions dogs have before a dog show, and whether or not they win a prize at the dog show. Which correlation should the researcher use to measure the relationship? Point-biserial correlation Spearman’s rho Cramer’s phi Pearson’s correlationarrow_forwardYou might expect the correlation between the horsepower of new cars and their gas mileages in miles per gallon to be: Group of answer choices A substantial negative correlation A substantial positive correlation A small correlationarrow_forward
- Describe about t RATIO FOR A SINGLE POPULATION CORRELATION COEFFICIENT.arrow_forwardThe maximum weights (in kilograms) for which one repetition of a half-squat can be performed and the jump heights (in centimeters) for 12 international soccer players are given in the accompanying table. The correlation coefficient, rounded to three decimal places, is r=0.707. At & = 0.05, is there enough evidence to conclude that there is a significant linear correlation between the variables? Click the icon to view the soccer player data. Determine the null and alternative hypotheses. Ho:p = 0 Ha:p # 0 Determine the critical value(s). to = (Round to three decimal places as needed. Use a comma to separate answers as needed.)arrow_forwardEnter your answers (A, B, C, D, E, F) in the boxes below. Negative Correlation low medium high 42 Positive Correlation low medium high Kaw THE 916 M SIPP%CORRMD051922.pptx (20/24) & 24. 150arrow_forward
- Q5. Crickets and TemperatureFind the best predicted temperature at a time when a cricket chirps 3000 times in 1 minute. Whatis wrong with this predicted temperature?Chirps in 1min882 1188 1104 864 1200 1032 960 900Temperature0?69.7 93.3 84.3 76.3 88.6 82.6 71.6 79.6 a) Find the value of the linear correlation coefficient ?b) Find the critical values of r from table A-6 using ∝= 0.05c) Determine whether there is sufficient evidence to support a claim of a linear correlationBetween the two variables.d) Find the regression equation,e) Letting the first variable be the predictor (x) variable, find the indicated predicted value.arrow_forwarduse the sample data to construct a scatterplot. Use the first variable for the x-axis. Based on the scatterplot, what do you conclude about a linear correlation? FORECAST AND ACTUAL TEMPERATURES The table lists actual high temperatures and the high temperatures that were previously forecasted for these same days. The table includes data for ten different days near the author’s home. What does the result suggest about the accuracy of five-day predicted high temperatures?arrow_forwardWhich plot indicates a correlation of 0.7? A R 8 8 in 10 Aarrow_forward
- An r value of .8 indicates a strong positive correlation. True Falsearrow_forwardWhich of the following statements about correlation is true? Question content area bottom Part 1 Choose the correct answer below. A. We say that there is a positive correlation between x and y if there is no distinct pattern in the scatterplot. B. We say that there is a positive correlation between x and y if the x-values increase as the corresponding y-values decrease. C. We say that there is a positive correlation between x and y if the x-values increase as the corresponding y-values increase. D. We say that there is a negative correlation between x and y if the x-values increase as the corresponding y-values increasearrow_forwardNote that this uses minitab. Make a scatterplot that will enable you to predict BBAC from number of beers consumed. What is the correlation coefficient?arrow_forward
arrow_back_ios
SEE MORE QUESTIONS
arrow_forward_ios
Recommended textbooks for you
 Algebra and Trigonometry (6th Edition)AlgebraISBN:9780134463216Author:Robert F. BlitzerPublisher:PEARSON
 Contemporary Abstract AlgebraAlgebraISBN:9781305657960Author:Joseph GallianPublisher:Cengage Learning
 Linear Algebra: A Modern IntroductionAlgebraISBN:9781285463247Author:David PoolePublisher:Cengage Learning
 Algebra And Trigonometry (11th Edition)AlgebraISBN:9780135163078Author:Michael SullivanPublisher:PEARSON
 Introduction to Linear Algebra, Fifth EditionAlgebraISBN:9780980232776Author:Gilbert StrangPublisher:Wellesley-Cambridge Press
 College Algebra (Collegiate Math)AlgebraISBN:9780077836344Author:Julie Miller, Donna GerkenPublisher:McGraw-Hill Education

Algebra and Trigonometry (6th Edition)
Algebra
ISBN:9780134463216
Author:Robert F. Blitzer
Publisher:PEARSON

Contemporary Abstract Algebra
Algebra
ISBN:9781305657960
Author:Joseph Gallian
Publisher:Cengage Learning

Linear Algebra: A Modern Introduction
Algebra
ISBN:9781285463247
Author:David Poole
Publisher:Cengage Learning

Algebra And Trigonometry (11th Edition)
Algebra
ISBN:9780135163078
Author:Michael Sullivan
Publisher:PEARSON

Introduction to Linear Algebra, Fifth Edition
Algebra
ISBN:9780980232776
Author:Gilbert Strang
Publisher:Wellesley-Cambridge Press

College Algebra (Collegiate Math)
Algebra
ISBN:9780077836344
Author:Julie Miller, Donna Gerken
Publisher:McGraw-Hill Education