Calculus: Early Transcendentals
8th Edition
ISBN: 9781285741550
Author: James Stewart
Publisher: Cengage Learning
expand_more
expand_more
format_list_bulleted
Question
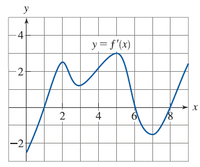
Use the graph of the derivative f ′ of a continuous function f is shown. (Assume f ′ continues to ∞.)
(b) At what value(s) of x does f have a local maximum ? (Enter your answers as a comma-separated list.)
At what value(s) of x does f have a local minimum ? (Enter your answers as a comma-separated list.)

Transcribed Image Text:This is a graph of the function \( y = f'(x) \), which represents the derivative of a function \( f(x) \). The graph is plotted on a coordinate grid with the x-axis labeled from 0 to 10 and the y-axis labeled from -2 to 4.
Key features of the graph:
- The curve starts below the x-axis, indicating that the derivative is initially negative.
- Around \( x = 1 \), the curve crosses into positive territory, peaks near \( y = 2.5 \), and then dips slightly before peaking again at approximately \( x = 4.5 \) with a value just over 3.
- The graph then descends rapidly, crossing the x-axis near \( x = 5.5 \), reaching a local minimum below \( y = -1 \) close to \( x = 6.5 \).
- The curve rises again, crossing the x-axis near \( x = 8.5 \), and continues upward.
This graph showcases the behavior of the derivative of a function, indicating changes in the slope of \( f(x) \). Points where \( y = f'(x) = 0 \) correspond to local maxima and minima of \( f(x) \).
Expert Solution
This question has been solved!
Explore an expertly crafted, step-by-step solution for a thorough understanding of key concepts.
This is a popular solution
Trending nowThis is a popular solution!
Step by stepSolved in 4 steps with 14 images

Follow-up Questions
Read through expert solutions to related follow-up questions below.
Follow-up Question
where does this concave up and down?
Solution
by Bartleby Expert
Follow-up Questions
Read through expert solutions to related follow-up questions below.
Follow-up Question
where does this concave up and down?
Solution
by Bartleby Expert
Knowledge Booster
Similar questions
- 4. Consider the function y = f (x) shown below to answer these questions: [= a. What is the domain of f? Answer using set or interval notation, or state "all real numbers." b. What is the range of f ? Answer using set or interval notation, or state "all real numbers." c. Find the value of f (11). Approximate if necessary. d. Find all values of x such that f(x) =2. Approximate if necessary. 8- 구 5- 3- -5 -4 -3 -2 -1 $ 9 10 11 12 13 -2 -3arrow_forwardGrab the function below. Label the axes sufficiently so that the five key pints can be identifiedarrow_forward
Recommended textbooks for you
 Calculus: Early TranscendentalsCalculusISBN:9781285741550Author:James StewartPublisher:Cengage Learning
 Thomas' Calculus (14th Edition)CalculusISBN:9780134438986Author:Joel R. Hass, Christopher E. Heil, Maurice D. WeirPublisher:PEARSON
 Calculus: Early Transcendentals (3rd Edition)CalculusISBN:9780134763644Author:William L. Briggs, Lyle Cochran, Bernard Gillett, Eric SchulzPublisher:PEARSON
 Calculus: Early TranscendentalsCalculusISBN:9781319050740Author:Jon Rogawski, Colin Adams, Robert FranzosaPublisher:W. H. Freeman
 Calculus: Early Transcendental FunctionsCalculusISBN:9781337552516Author:Ron Larson, Bruce H. EdwardsPublisher:Cengage Learning

Calculus: Early Transcendentals
Calculus
ISBN:9781285741550
Author:James Stewart
Publisher:Cengage Learning

Thomas' Calculus (14th Edition)
Calculus
ISBN:9780134438986
Author:Joel R. Hass, Christopher E. Heil, Maurice D. Weir
Publisher:PEARSON

Calculus: Early Transcendentals (3rd Edition)
Calculus
ISBN:9780134763644
Author:William L. Briggs, Lyle Cochran, Bernard Gillett, Eric Schulz
Publisher:PEARSON

Calculus: Early Transcendentals
Calculus
ISBN:9781319050740
Author:Jon Rogawski, Colin Adams, Robert Franzosa
Publisher:W. H. Freeman


Calculus: Early Transcendental Functions
Calculus
ISBN:9781337552516
Author:Ron Larson, Bruce H. Edwards
Publisher:Cengage Learning