
MATLAB: An Introduction with Applications
6th Edition
ISBN: 9781119256830
Author: Amos Gilat
Publisher: John Wiley & Sons Inc
expand_more
expand_more
format_list_bulleted
Related questions
Question
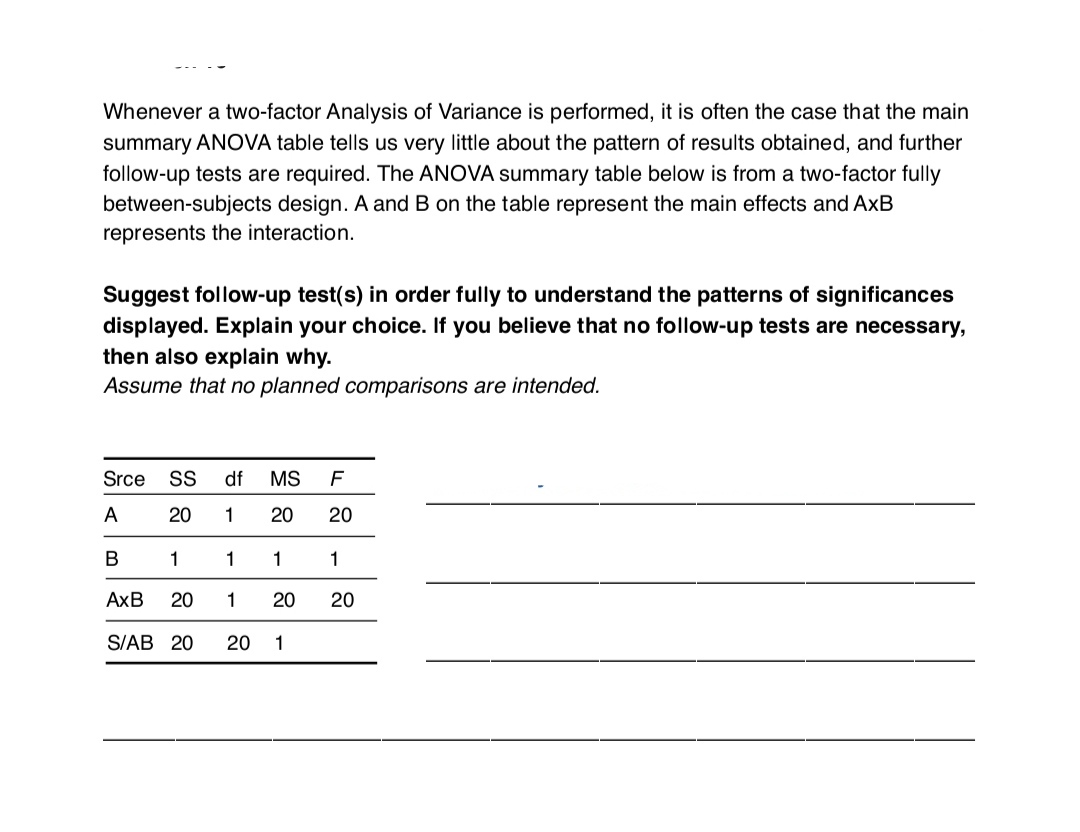

Transcribed Image Text:Whenever a two-factor Analysis of Variance is performed, it is often the case that the main
summary ANOVA table tells us very little about the pattern of results obtained, and further
follow-up tests are required. The ANOVA summary table below is from a two-factor fully
between-subjects design. A and B on the table represent the main effects and AxB
represents the interaction.
Suggest follow-up test(s) in order fully to understand the patterns of significances
displayed. Explain your choice. If you believe that no follow-up tests are necessary,
then also explain why.
Assume that no planned comparisons are intended.
Srce SS df MS F
A
20 1
20 20
B
1
AxB
20
S/AB 20 20 1
1
1
1 20 20
1
Expert Solution
This question has been solved!
Explore an expertly crafted, step-by-step solution for a thorough understanding of key concepts.

Step by stepSolved in 2 steps

Knowledge Booster

Similar questions
- Suppose Ava, an education researcher, wants to understand the relationship between foreign language skills and English verbal aptitude for middle school students in her school district. In order to draw an inference about the population linear correlation coefficient, p, for foreign language skills and English verbal aptitude, she conducts a hypothesis test at a significance level of a = 0.01 to determine if there is a significant linear correlation between the two variables. Ava selects a simple random sample of 33 Verbal aptitude test score vs. foreign language grade eighth grade students within her school district. She gathers the students' final seventh 80- grade foreign language course grades and their test scores from an English verbal 60 - aptitude test. 40- Ava produces a scatter plot with the foreign language course grades on the horizontal axis and the verbal aptitude test scores on the 20 - vertical axis. The Pearson product-moment correlation coefficient, r, for her sample…arrow_forwardWhat does it mean when sample results are not statistically significant?arrow_forwardThe accompanying table lists distances (mm) between pupils of randomly selected U.S. Army personnel collected as part of a large reputable study. Results from two-way analysis of variance are also shown. Use the displayed results and use a 0.05 significance level. What do you conclude? Click the icon to view the data and two-way analysis of variance results. First test for an interaction between the two factors. Determine the null and alternative hypotheses. Choose the correct answer below. A. Ho: Distances between pupils are not affected by an interaction between gender and handedness. H₁: Distances between pupils are affected by an interaction between gender and handedness. B. Ho: Distances between pupils are not affected by gender. H₁: Distances between pupils are affected by gender. C. Ho: Distances between pupils are not affected by handedness. H₁: Distances between pupils are affected by handedness. D. Ho: Distances between pupils are affected by an interaction between gender and…arrow_forward
- if a researcher undertook an experiment to evaluate the efficacy of a memory enhancement technique among a cohort of 15 college students. The memory recall abilities of each student were assessed both before and after they underwent training in the memory technique. The observed average increase in memory recall scores following the training was 5 points. The sample variance of the differences within the entire sample was denoted as 8. Does this research question aim to ascertain whether there is a statistically significant elevation in memory recall scores after the implementation of the memory improvement training? To address this question, a one-tailed test with a significance level of (alpha = 0.01) is employed.arrow_forwardIn general, what factors are most likely to reject the null hypothesis for an ANOVA? a. small mean differences and small variances b. small mean differences and large variances c. large mean differences and small variances d. large mean differences and large variancesarrow_forwardThe accompanying table lists pulse rates. Use a 0.05 significance level and apply the methods of two-way analysis of variance. What is the conclusion? State the null and alternative hypotheses in the test for the effect of an interaction between row and column factors. Ho: There interaction between gender and age. H₁: There interaction between gender and age. What is the value of the test statistic for this test? O B. Ho: The row values are from populations with the same standard deviation. H₁: At least one of the rows is sampled from a population with a standard deviation different from the others. F= (Round to two decimal places as needed.) What is the corresponding P-value of the test statistic, F, for this test? P-value = (Round to three decimal places as needed.) State the conclusion of this test. Ho. There sufficient evidence to warrant rejection of the claim that pulse rates are not affected by an interaction between gender and age. There State the null and alternative…arrow_forward
- Say we were testing the effects of taking calcium on bone density levels and obtained a positive and significant value for our independent t test result. What would you write (using APA format) when performing a percentage of variance explained test on the data and received a value of r2=.38.arrow_forwardYou think that there might be a relationship between stress for Middle Schoolers and the number of after-school activities that the student participates in. Conduct an ANOVA with an 8-step hypothesis on the following data to find if there if there is a significant relationship occurring. # of after school activities Stress Scores 0 1 0 2 0 8 1-2 3 1-2 10 1-2 4 1-2 2 1-2 6 3 or more 9 3 or more 8 3 or more 3arrow_forwardIs what I have here already correct? And how should I word the second part of the of the question?arrow_forward
- A personal fitness company produces both a deluxe and a standard model of a smoothie blender for home use. Selling prices obtained from a sample of retail outlets follow. Model Price ($) Retail Outlet Deluxe Standard 1 39 27 39 29 3 45 35 4 38 30 5 40 30 6 39 34 7 34 29 (a) The manufacturer's suggested retail prices for the two models show a $10 price differential. Use a 0.05 level of significance and test that the mean difference between the prices of the two models is $10. State the null and alternative hypotheses. (Use u, = mean price for the deluxe model – mean price for the standard model.) O Ho: Hg + 10 H: H = 10 O Ho: Hg s 10 H: Hg > 10 O Ho: H > 10 H: ug s 10 O Ho: H = 10 Ha: s 10 O Ho: Hd = 10 H: Hg + 10 Calculate the value of the test statistic. (Round your answer to three decimal places.) |-1.159 Calculate the p-value. (Round your answer to four decimal places.) p-value = 2.58 State your conclusion. O Reject H.. There is insufficient evidence to conclude that a $10 price…arrow_forwardA bank has a Head Office in Delhi and a branch at Mumbai. There are long customer queues at one office, while customer queues are short at the other office. The Operations Manager of the bank wonders if the customers at one branch are more variable than the number of customers at another branch. A research study of customers is carried out by him. The variance of Delhi Head Office customers is 31 and that for Mumbai branch is 20. The sample size for Delhi Head Office is 11 and that for Mumbai branch is 21. Use a 5 % level of significance to test the difference in variance for both the branches.arrow_forwardStudents in one class are asked to complete the same questionnaire 3 times throughout the semester: at the beginning, at the midterm, and at the end. The purpose of the questionnaire is to track students' perception of their progress at different points in the semester. Scores at Time 1 (beginning of the semester), Time 2 (midterm), and Time 3 (end of semester) are compared against one another. What type of analysis of variance would be appropriate for examining the results from this dataset?arrow_forward
arrow_back_ios
SEE MORE QUESTIONS
arrow_forward_ios
Recommended textbooks for you
- MATLAB: An Introduction with ApplicationsStatisticsISBN:9781119256830Author:Amos GilatPublisher:John Wiley & Sons Inc
 Probability and Statistics for Engineering and th...StatisticsISBN:9781305251809Author:Jay L. DevorePublisher:Cengage Learning
 Statistics for The Behavioral Sciences (MindTap C...StatisticsISBN:9781305504912Author:Frederick J Gravetter, Larry B. WallnauPublisher:Cengage Learning
  Elementary Statistics: Picturing the World (7th E...StatisticsISBN:9780134683416Author:Ron Larson, Betsy FarberPublisher:PEARSON
 The Basic Practice of StatisticsStatisticsISBN:9781319042578Author:David S. Moore, William I. Notz, Michael A. FlignerPublisher:W. H. Freeman
 Introduction to the Practice of StatisticsStatisticsISBN:9781319013387Author:David S. Moore, George P. McCabe, Bruce A. CraigPublisher:W. H. Freeman
MATLAB: An Introduction with Applications
Statistics
ISBN:9781119256830
Author:Amos Gilat
Publisher:John Wiley & Sons Inc
Probability and Statistics for Engineering and th...
Statistics
ISBN:9781305251809
Author:Jay L. Devore
Publisher:Cengage Learning
Statistics for The Behavioral Sciences (MindTap C...
Statistics
ISBN:9781305504912
Author:Frederick J Gravetter, Larry B. Wallnau
Publisher:Cengage Learning
Elementary Statistics: Picturing the World (7th E...
Statistics
ISBN:9780134683416
Author:Ron Larson, Betsy Farber
Publisher:PEARSON
The Basic Practice of Statistics
Statistics
ISBN:9781319042578
Author:David S. Moore, William I. Notz, Michael A. Fligner
Publisher:W. H. Freeman
Introduction to the Practice of Statistics
Statistics
ISBN:9781319013387
Author:David S. Moore, George P. McCabe, Bruce A. Craig
Publisher:W. H. Freeman