
A First Course in Probability (10th Edition)
10th Edition
ISBN: 9780134753119
Author: Sheldon Ross
Publisher: PEARSON
expand_more
expand_more
format_list_bulleted
Related questions
Question
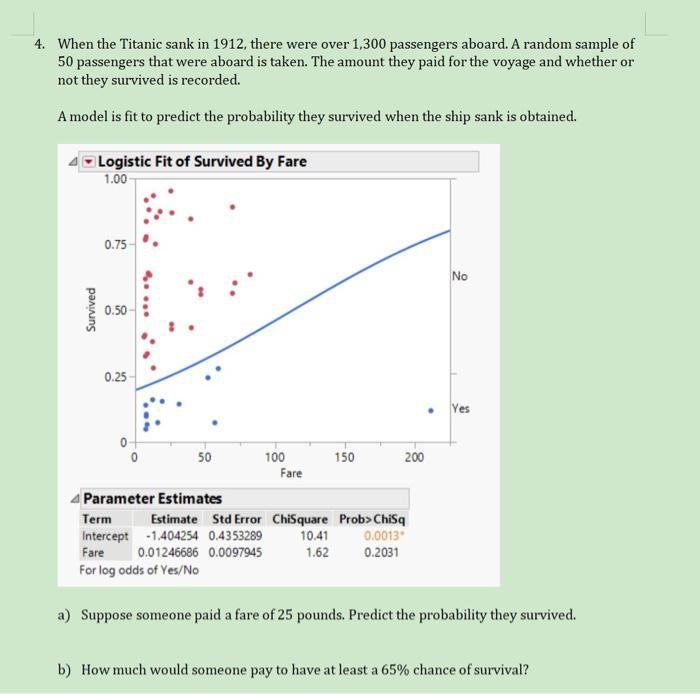

Transcribed Image Text:4. When the Titanic sank in 1912, there were over 1,300 passengers aboard. A random sample of
50 passengers that were aboard is taken. The amount they paid for the voyage and whether or
not they survived is recorded.
A model is fit to predict the probability they survived when the ship sank is obtained.
Survived
Logistic Fit of Survived By Fare
1.00
0.75
0.50-
0.25-
50
4 Parameter Estimates
100
Term
Intercept -1.404254 0.4353289
Fare
0.01246686 0.0097945
For log odds of Yes/No
Fare
Estimate Std Error ChiSquare
10.41
1.62
150
200
Prob>ChiSq
0.0013*
0.2031
No
Yes
a) Suppose someone paid a fare of 25 pounds. Predict the probability they survived.
b) How much would someone pay to have at least a 65% chance of survival?
Expert Solution
This question has been solved!
Explore an expertly crafted, step-by-step solution for a thorough understanding of key concepts.

Step by stepSolved in 4 steps with 4 images

Knowledge Booster

Similar questions
- lecture(12.5a): The mean of the population is 50. The standard deviation is 10. If a person row score is 47 (a) What is the percentile rank?arrow_forwardTerri Vogel, an amateur motorcycle racer, averages 129.42 seconds per 2.5 mile lap (in a 7 lap race) with a standard deviation of 2.29 seconds . The distribution of her race times is normally distributed. We are interested in one of her randomly selected laps. (Source: log book of Terri Vogel) Let X be the number of seconds for a randomly selected lap. Round all answers to 4 decimal places where possible. b. Find the proportion of her laps that are completed between 131.37 and 133.62 seconds. ? c. The fastest 3% of laps are under ? seconds. d. The middle 40% of her laps are from ? seconds to ? secondarrow_forwardAssume that a randomly selected subject is given a bone density test. Bone density test scores are normally distributed with a mean of 0 and a standard deviation of 1. Draw a graph and find P12, the 12th percentile. This is the bone density score separating the bottom 12% from the top 88%. Which graph represents P12? Choose the correct graph below. P12 The bone density score corresponding to P12 is (Round to two decimal places as needed.) O B. P₁2 ✔ C O C. P12 O D. P12arrow_forward
- The number of cans of soft drinks sold in a machine each week is recorded below. Develop forecasts for the period indicated and error calculations. 155, 145, 155, 162, 180, 165, 172, 149, 170, 172 Exponential smoothing. Use an alpha level of .8 What is the Mean Squared Error (MSE). What is the Mean Absolute Percentage Error (MAPE).arrow_forwardTerri Vogel, an amateur motorcycle racer, averages 129.97 seconds per 2.5 mile lap (in a 7 lap race) with a standard deviation of 2.26 seconds . The distribution of her race times is normally distributed. We are interested in one of her randomly selected laps. (Source: log book of Terri Vogel) Let X be the number of seconds for a randomly selected lap. Round all answers to 4 decimal places where possible.b. Find the proportion of her laps that are completed between 128.02 and 129.92 seconds. c. The fastest 2% of laps are under seconds.d. The middle 40% of her laps are from seconds to seconds.arrow_forwardFind the value of so that 92.3% of the data lies to the right of it.arrow_forward
- Terri Vogel, an amateur motorcycle racer, averages 129.52 seconds per 2.5 mile lap (in a 7 lap race) with a standard deviation of 2.28 seconds . The distribution of her race times is normally distributed. We are interested in one of her randomly selected laps. (Source: log book of Terri Vogel) Let X be the number of seconds for a randomly selected lap. Round all answers to 4 decimal places where possible. b. Find the proportion of her laps that are completed between 128.81 and 131.26 seconds c. The fastest 3% of laps are under ____ seconds. d. The middle 80% of her laps are from __________ seconds to __________ seconds.arrow_forwardTerri Vogel, an amateur motorcycle racer, averages 129.14 seconds per 2.5 mile lap (in a 7 lap race) with a standard deviation of 2.28 seconds . The distribution of her race times is normally distributed. We are interested in one of her randomly selected laps. (Source: log book of Terri Vogel) Let X be the number of seconds for a randomly selected lap. Round all answers to 4 decimal places where possible.b. Find the proportion of her laps that are completed between 131.08 and 134.03 seconds. ___________________c. The fastest 2% of laps are under seconds.____________________d. The middle 70% of her laps are from ____ seconds to ____ seconds.arrow_forwardTerri Vogel, an amateur motorcycle racer, averages 129.41 seconds per 2.5-mile lap (in a 7 lap race) with a standard deviation of 2.25 seconds. The distribution of her race times is normally distributed. We are interested in one of her randomly selected laps. (Source: logbook of Terri Vogel) Let X be the number of seconds for a randomly selected lap. Round all answers to 4 decimal places where possible. Find the proportion of her laps that are completed between 129.57 and 130.63 seconds. (______)The fastest 3% of laps are under(______) seconds. The middle 40% of her laps are from(_____) seconds to(_______) seconds.arrow_forward
- Find SAT Quartiles. SAT scores are reported on a scale from 600 to 2400. The mean is 1498 and the standard deviation is 316. The quartiles of any distribution are the values with cumulative proportions 0.25, and 0.75. What are the quartiles of the distribution of SAT scores?arrow_forwardWhat type of data would you use for collecting data on lap swim time?arrow_forwardA survey is carried out at a university to estimate the percentage of undergraduates living at home during the current term. What is the population? the parameter?arrow_forward
arrow_back_ios
SEE MORE QUESTIONS
arrow_forward_ios
Recommended textbooks for you
- A First Course in Probability (10th Edition)ProbabilityISBN:9780134753119Author:Sheldon RossPublisher:PEARSON

A First Course in Probability (10th Edition)
Probability
ISBN:9780134753119
Author:Sheldon Ross
Publisher:PEARSON