MATLAB: An Introduction with Applications
6th Edition
ISBN: 9781119256830
Author: Amos Gilat
Publisher: John Wiley & Sons Inc
expand_more
expand_more
format_list_bulleted
Question
thumb_up100%
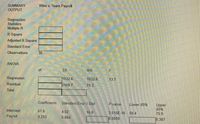
26) Below is some of the regression output from a simple regression of the number of wins for a major league baseball team and the size amount of money the team is paying its players (expressed in millions of $'s)
*fill in the blank table*
Suppose that the team owner is trying to decide whether to pay a particular free agent player. Based on the player's previous statistics, the owner thinks that the new player can help his team increase the number of wins but the new player is going to cost more than the player he will be replacing. The owner decides it is a good idea to sign the new player if he can be pretty sure that the coefficient is at least 0.20. When testing this hypothesis, what is the test statistic?
(please express your answer using 2 decimal places)

Transcribed Image Text:SUMMARY
Wins v. Team Payroll
OUTPUT
Regression
Statistics
Multiple R
R Square
Adjusted R Square
Standard Error
Observations
30
ANOVA
df
SS
MS
Regression
1032.6
1032.6
13.7
Residual
2109.7
75.3
Total
Coefficients
Standard Error t Stat
P-value
Lower 95%
Upper
95%
Intercept
Payroll
67.6
4.02
16.8
3.515E-16 59.4
75.9
0.253
0.064
10.0009
10.387
Expert Solution
This question has been solved!
Explore an expertly crafted, step-by-step solution for a thorough understanding of key concepts.
Step by stepSolved in 2 steps

Knowledge Booster
Similar questions
- The following regression equation is based on the analysis of four variables: SM_DOLLARS is the dollar amount of a watershed conservation agency's weekly spending on social media ads. RADIO_ADS is the number of radio advertisements aired weekly by the agency. WS_DOLLARS is the dollar amount of the agency’s weekly spending on web search ads. The variable WEB_VISITS is the number of weekly visitors to their educational website. These data have been recorded every week for the past three years. WEB_VISITS (expected) = 208 + 1.5*SM_DOLLARS + 0.5*RADIO_ADS + 0.8*WS_DOLLARS The data meet the assumptions for regression analysis, and the regression results, including the coefficients, were found to be statistically significant. How many additional weekly web visits would you predict when the agency increases its weekly spending on social media ads by $108 without changing the amount spent on radio ads or web search ads? (Round your answer to the nearest whole number.)arrow_forwardDefine linear regression?arrow_forwardImagine that you, a social psychologist, study people living with HIV. You are interested in the relationship between viral load, the amount of HIV in a sample of blood, and perceived stigma, the amount people with HIV perceive others to hold stigmatizing views about their condition. You have 100 people with HIV complete a perceived stigma scale, as well as provide a sample of blood, so their viral load can be measured. You run a regression analysis using the data you’ve collected to see whether perceived stigma can be predicted based on viral load. The output from the analysis is presented below: How much does the estimate of perceived stigma change if viral load increases by one unit?arrow_forward
- ** Based on the regression results, answer the following questions ** A sample of data is collected (from 1999 and 2000) concerning the compensation of the executives (compensation is measured in 1000’s of $’s) of a number of public companies along with other firm-specific data. The dependent variable is total compensation, CEOANN is a dummy variable =1 for an individual who is a CEO and =0 for individuals who are not CEO’s, EMPL is total employees, MKTVAL is the natural logarithm of the market value of the firm, EPSIN is earnings per share, YEAR is a dummy variable = 1 for the year 2000 and =0 for year 1999, and ASSETS is the natural logarithm of the total assets of the company. Based on the regression results, answer the following questions b) What is the estimated regression equation? c) What percentage of the variation in income in explained by the regressors? d) What is the standard error of the error term in the regression equation?arrow_forwardIf you have 2 datasets on which you have conducted a regression analysis, how would you determine whether you can combine them into one dataset?arrow_forwardDoes the Regression line give information about all the data points in the data set? Does the Regression line usually have all the points in the data set on it?arrow_forward
arrow_back_ios
arrow_forward_ios
Recommended textbooks for you
 MATLAB: An Introduction with ApplicationsStatisticsISBN:9781119256830Author:Amos GilatPublisher:John Wiley & Sons Inc
 Probability and Statistics for Engineering and th...StatisticsISBN:9781305251809Author:Jay L. DevorePublisher:Cengage Learning
 Statistics for The Behavioral Sciences (MindTap C...StatisticsISBN:9781305504912Author:Frederick J Gravetter, Larry B. WallnauPublisher:Cengage Learning
 Elementary Statistics: Picturing the World (7th E...StatisticsISBN:9780134683416Author:Ron Larson, Betsy FarberPublisher:PEARSON
 The Basic Practice of StatisticsStatisticsISBN:9781319042578Author:David S. Moore, William I. Notz, Michael A. FlignerPublisher:W. H. Freeman
 Introduction to the Practice of StatisticsStatisticsISBN:9781319013387Author:David S. Moore, George P. McCabe, Bruce A. CraigPublisher:W. H. Freeman

MATLAB: An Introduction with Applications
Statistics
ISBN:9781119256830
Author:Amos Gilat
Publisher:John Wiley & Sons Inc

Probability and Statistics for Engineering and th...
Statistics
ISBN:9781305251809
Author:Jay L. Devore
Publisher:Cengage Learning

Statistics for The Behavioral Sciences (MindTap C...
Statistics
ISBN:9781305504912
Author:Frederick J Gravetter, Larry B. Wallnau
Publisher:Cengage Learning

Elementary Statistics: Picturing the World (7th E...
Statistics
ISBN:9780134683416
Author:Ron Larson, Betsy Farber
Publisher:PEARSON

The Basic Practice of Statistics
Statistics
ISBN:9781319042578
Author:David S. Moore, William I. Notz, Michael A. Fligner
Publisher:W. H. Freeman

Introduction to the Practice of Statistics
Statistics
ISBN:9781319013387
Author:David S. Moore, George P. McCabe, Bruce A. Craig
Publisher:W. H. Freeman