
A First Course in Probability (10th Edition)
10th Edition
ISBN: 9780134753119
Author: Sheldon Ross
Publisher: PEARSON
expand_more
expand_more
format_list_bulleted
Related questions
Question
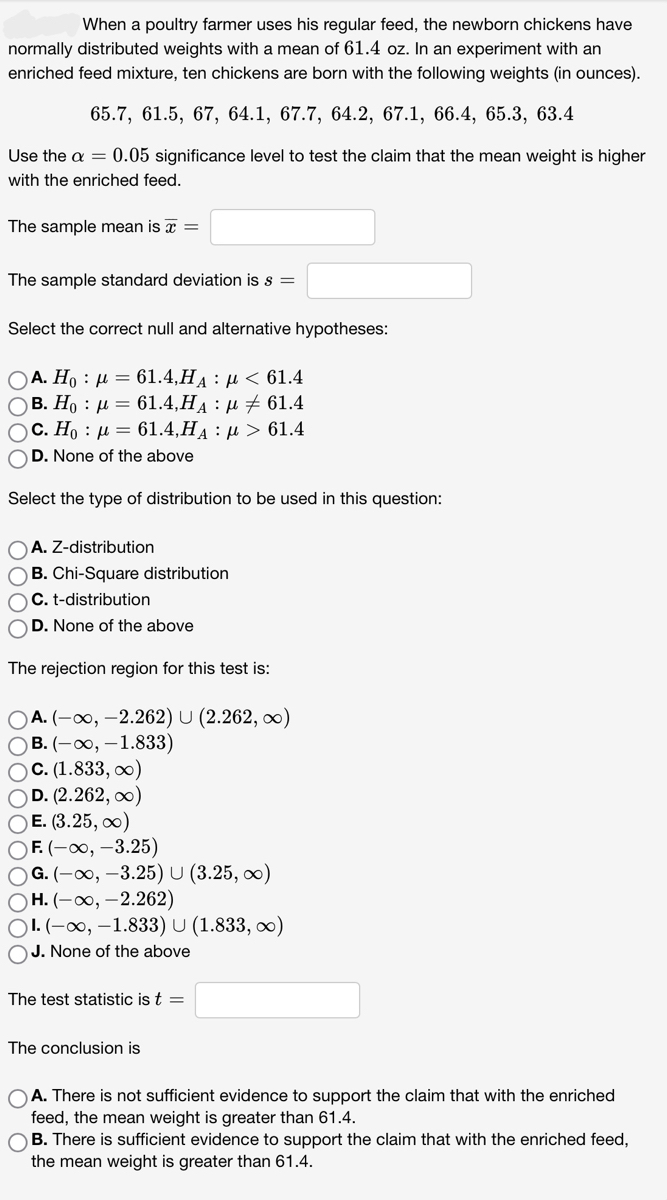

Transcribed Image Text:When a poultry farmer uses his regular feed, the newborn chickens have
normally distributed weights with a mean of 61.4 oz. In an experiment with an
enriched feed mixture, ten chickens are born with the following weights (in ounces).
65.7, 61.5, 67, 64.1, 67.7, 64.2, 67.1, 66.4, 65.3, 63.4
Use the a = 0.05 significance level to test the claim that the mean weight is higher
with the enriched feed.
The sample mean is a =
The sample standard deviation is s =
Select the correct null and alternative hypotheses:
Ο Α. Η : μ = 61.4,HA : μ < 61.4
OB. Ho μ = 61.4,HA μ ‡ 61.4
( c. H : μ = 61.4,HA : μ > 61.4
OD. None of the above
Select the type of distribution to be used in this question:
OA. Z-distribution
OB. Chi-Square distribution
OC. t-distribution
D. None of the above
The rejection region for this test is:
OA. (-∞, -2.262) U (2.262, ∞)
OB. (-∞, -1.833)
OC. (1.833, ∞)
OD. (2.262, ∞)
OE. (3.25, ∞)
OF. (-∞, -3.25)
OG. (-∞, -3.25) U (3.25, ∞)
OH. (-∞, -2.262)
OI.(-∞, -1.833) U (1.833, ∞)
OJ. None of the above
The test statistic is t =
The conclusion is
A. There is not sufficient evidence to support the claim that with the enriched
feed, the mean weight is greater than 61.4.
OB. There is sufficient evidence to support the claim that with the enriched feed,
the mean weight is greater than 61.4.
Expert Solution
This question has been solved!
Explore an expertly crafted, step-by-step solution for a thorough understanding of key concepts.
Step 1: Find sample mean
VIEW Step 2: Find sample standard deviation
VIEW Step 3: Determine the null and alternative hypotheses:
VIEW Step 4: Determine the type of distribution to be used
VIEW Step 5: Find the rejection region:
VIEW Step 6: Find the test statistic:
VIEW Step 7: Make conclusion:
VIEW Solution
VIEW 
Step by stepSolved in 8 steps with 6 images

Knowledge Booster

Similar questions
- I need help with a., b., c., and d.arrow_forwardThe Yonkers integrity auditor examined the weights of Oreo cookies for 12 randomly selected Oreo cookies The sample gave the following results in grams: 11.22,11.35,11.50,11.73,11.42,11.15,11.43,11.65,11.56,11.06,10.82,10.99 Weights of Oreo cookies are known to be normally distributed, with an unknown mean of μ and an unknown standard deviation o. a) Calculate the sample mean for this data. b) Calculate the sample standard deviation for this data. c) Calculate the sample median for this data. d) Calculate the sample range for this data. (One number) e) Calculate the sample variance for this data. f) Suppose W has a t distribution with 11 degrees of freedom. If P(W > t) = .05 then what is t? g) Suppose W has a t distribution with 11 degrees of freedom. If P(Warrow_forwardListed below are the lead concentrations in μg/g measured in different traditional medicines. Use a 0.10 significance level to test the claim that the mean lead concentration for all such medicines is less than 18 μg/g. Assume that the sample is a simple random sample. 12.5 11 10.5 21 11.5 17.5 8 12 8 18.5arrow_forward
- In a random sample of 925 plain M&M's, 19% were blue. Use a 0.01 significance level to test the claim of Mars, Inc. that 24% of its plain M&M candies are blue. a. Define the parameter A. p = The proportion of all M&M's that are blue B. mu = The proportion of all M&M's that are blue C. mu = The mean number of all M&M's that are blue D. p = The proportion of all M&M's that are not blue b. State the null and alternative hypotheses A. Upper H 0 : p greater than 0.24 Upper H 1 : p equals 0.24 B. Upper H 0 : p equals 0.19 Upper H 1 : p not equals 0.19 C. Upper H 0 : p equals 0.24 Upper H 1 : p not equals 0.24 D. Upper H 0 : mu not equals 0.24 Upper H 1 : mu equals 0.24 c. Calculate the test statistic. Which of these options is closest to the test statistic? A. negative 4.00 B. negative 3.65 C.…arrow_forwardFind the range, variance, and standard deviation for the given sample data, if possible. If the measures of variation can be obtained for these values, do the results make sense? Biologists conducted experiments to determine whether a deficiency of carbon dioxide in the soil affects the phenotypes of peas. Listed below are the phenotype codes, where 1 equals smooth-yellow, 2 equals smooth-green, 3 equals wrinkled yellow, and 4 equals wrinkled-green. a. The range of the sample data is (Type an integer or a decimal. Do not round.) b. the standard deviation of the sample data is (Round to one decimal place as needed.) c. The variance of the sample data is (Round to one decimal place as needed.)arrow_forwardA dietitian wishes to see if a person's cholesterol level will change if the diet is supplemented by a certain mineral. Seven subjects were pretested and then took the mineral supplement for a six-week period. The results are shown below in the table. Use a paired samples t-chart at a = 0.01 significance level to see difference (Before - After) between the cholesterol levels. State the hypotheses and conclusion. Also, conduct a 99% confidence interval. Subject 1 Before 210 After 190 2 205 170 3 208 210 4 192 188 5 178 173 6 244 228 7 211 198arrow_forward
- The mean potassium content of a popular sports drink is listed as 132 mg in a 32-oz bottle. Analysis of 24 bottles indicates a sample mean of 131.2 mg. (a) State the hypotheses for a two-tailed test of the claimed potassium content.. a. Ho: μ= 132 mg vs. H₁: b. He: ≤132 mg vs. H₁: c. He: ≥132 mg vs. H₁: Oa Ob Oc (b) Assuming a known standard deviation of 2.1 mg, calculate the z test statistic to test the manufacturer's claim. (Round your answer to 2 decimal places. A negative value should be indicated by a minus sign.) Test statistic 132 mg >132 mg <132 mg (c) At the 2 percent level of significance (a = .02) does the sample contradict the manufacturer's claim? Decision Rule: Reject Hoarrow_forwardListed below are the lead concentrations in μg/g measured in different traditional medicines. Use a 0.10 significance level to test the claim that the mean lead concentration for all such medicines is less than 21 μg/g. Assume that the sample is a simple random sample. 19.5 21 7.5 19 14 20 10 12 21.5 16.5arrow_forward
arrow_back_ios
arrow_forward_ios
Recommended textbooks for you
- A First Course in Probability (10th Edition)ProbabilityISBN:9780134753119Author:Sheldon RossPublisher:PEARSON

A First Course in Probability (10th Edition)
Probability
ISBN:9780134753119
Author:Sheldon Ross
Publisher:PEARSON