
Elements Of Electromagnetics
7th Edition
ISBN: 9780190698614
Author: Sadiku, Matthew N. O.
Publisher: Oxford University Press
expand_more
expand_more
format_list_bulleted
Related questions
Concept explainers
Question
help
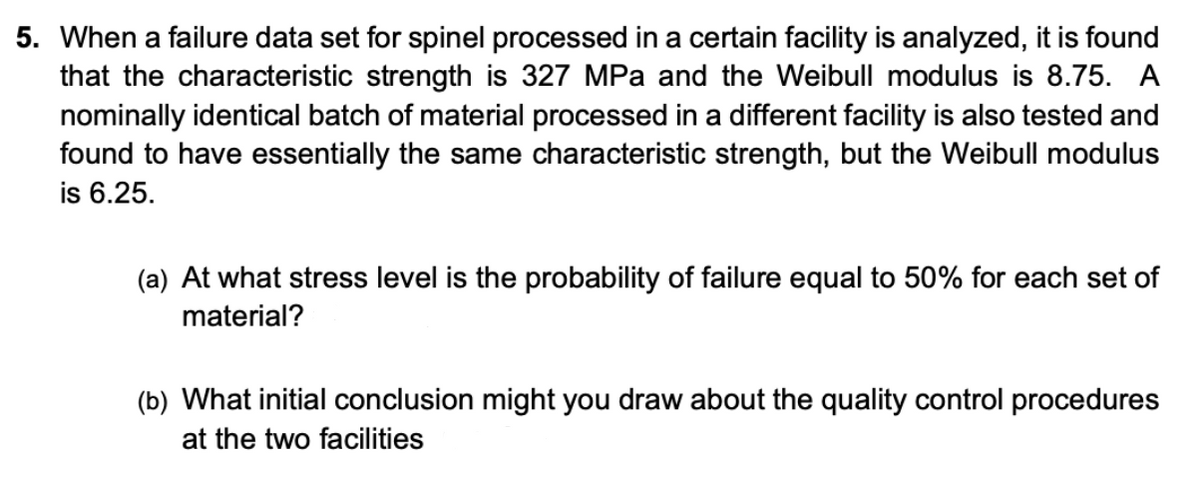

Transcribed Image Text:5. When a failure data set for spinel processed in a certain facility is analyzed, it is found
that the characteristic strength is 327 MPa and the Weibull modulus is 8.75. A
nominally identical batch of material processed in a different facility is also tested and
found to have essentially the same characteristic strength, but the Weibull modulus
is 6.25.
(a) At what stress level is the probability of failure equal to 50% for each set of
material?
(b) What initial conclusion might you draw about the quality control procedures
at the two facilities
Expert Solution
This question has been solved!
Explore an expertly crafted, step-by-step solution for a thorough understanding of key concepts.

This is a popular solution

Trending nowThis is a popular solution!

Step by stepSolved in 3 steps

Knowledge Booster


Learn more about
Need a deep-dive on the concept behind this application? Look no further. Learn more about this topic, mechanical-engineering and related others by exploring similar questions and additional content below.Similar questions
- The following data were obtained from the tensile test of Aluminum alloy. The initial diameter of testspecimen was 0.505 inch and gauge length was 2.0 inch. Plot the stress strain diagram and determine(a) Proportional Limit (b) Modulus of Elasticity (c) Yield Stress at 0.2% offset (d) Ultimate Stress and(e) Nominal Rupture Stress.arrow_forwardThe following stress-strain curve was prepared based on a tensile test of a specimen that had a circular cross-section. The gage diameter of the specimen was 0.25 inches and the gage length was 4 inches. The stress scale of the stress-strain diagram is given with the factor a = 10 ksi. Estimate: (a) The modulus of elasticity. (b) The ultimate strength. (c) The yield strength (0.2% offset). (d) The percent elongation at fracture. 2013 Michael Swanbom STRESS VS. STRAIN BY NC SA 7a bat Sat 2at at 0.05 STRAIN 0.01 0.04 0.06 0.08 0.02 0.03 0.07 0.09 STRESSarrow_forwardI just can't find The percent elongation at fracture.arrow_forward
- tensile test uses a circular test specimen that has a gage length of 50 mm and diameter = 20 mm. During the test the specimen yields under a load of 100,000 N. The corresponding gage length = 50.5 mm. This is the 0.2% yield point. The maximum load of 180,000 N is reached at a gage length = 65 mm. Determine (a) yield strength, (b) modulus of elasticity, and (c) tensile strength. (d) If fracture occurs at a gage length of 73 mm, determine the ductility. i need clear ans by hand and solve very very fast in 20 min and thank you | DYBALAarrow_forward1. For the stress-strain curve shown below, please estimate the properties indicated. (a) Fracture Strain Please do your work on a separate sheet of paper, and put your answers in the boxes on the right. Be sure to include the proper symbol and units. Stress Strain 70 60 50 Stress (ksi) 240 30 20 10 70 0 0.000 60 50 Stress (ksi) 40 20 10 KULL 0 0.000 0.010 0.050 0.100 Strain (in/in) Stress Strain 0.020 0.030 Strain (in/in) 0.040 0.150 0.050 (b) Ultimate Tensile Stress (c) Fracture Stress (d) Proportional Limit (e) Elastic Modulus (1) Yield Stress (g) Tensile Toughness (Modulus of Toughness) (h) Modulus of Resiliencearrow_forwardStress Strain Diagram The Data shown in the table have been obtained from a tensile test conducted on a high-strength steel. The test specimen had a diameter of 0.505 inch and a gage length of 2.00 inch. Using software. plot the Stress-Strain Diagram for this steel and determine its: A= TTdT(050s A %3D 1. Proportional Limit, 2. Modulus of Elasticity, 3. Yield Strength (SY) at 0.2% Offset, 4. Ultimate Strength (Su), 5. Percent Elongation in 2.00 inch, 6. Percent Reduction in Area, 7. Present the results (for Steps 1-6) in a highly organized table. e Altac ie sheet (as problelle 4 A = 0.2.002 BEOINNING of the effort Elongation (in) Elongation (In) Load Load #: #3 (Ib) (Ib) 1 0.0170 15 12,300 0.0004 1,500 16 12,200 0.0200 0.0010 3. 3,100 17 12,000 0.0275 0.0016 4,700 18 13,000 0.0335 5. 6,300 0.0022 19 15,000 0.0400 0.0026 6. 8,000 20 16,200 0.055 0.0032 9,500 21 17,500 0.0680 0.0035 8. 11,000 22 18,800 0.1080 0.0041 11,800 23 19,600 0.1515 0.0051 24 20,100 0.2010 10 12,300 0.0071 25…arrow_forward
- The % of error between a theoretical shear modulus of 65 GPa and an experimental modulus of rigidity of 60235 MPa is: Select one: O a. 0.0791 % O b. 7.33 % O c. 0.0668 % O d. 7.9 % Torrion test is annlied to study the properties of a material subjected to tensile force.arrow_forwardQI (a) A tensile stress is to be applied along the axis of a cylindrical steel rod that has a diameter of 7.5 mm. Given the Poisson's ratio, v is 0.30 and the modulus of elasticity, E of the steel is 207 GPa. Determine the magnitude of the load required to produce a 2.5 x10³ mm change in diameter if the deformation is entirely elastic. (b) Referring to the tensile test data tabulated in Table 1, answer the following questions: i. Select with justification the material that will experience the greatest percent reduction in area. ii. Select with justification which material is the strongest. Table 1. Tensile stress-strain data for several hypothetical metals Material Yield Tensile Strain at Fracture Elastic Strength Strength Fracture Strength Modulus (МРа) (MPa) (MPa) (GPa) A 310 340 0.23 265 210 100 120 0.40 105 150 C 415 550 0.15 500 310 D 700 850 0.14 720 210 E Fracture before yielding 650 350arrow_forwardi need the answer quicklyarrow_forward
- I need the answer as soon as possiblearrow_forwardi need the answer quicklyarrow_forwardDraw a typical stress vs strain tensile test curve for the following material and label the axis. A typical brittle material subjected to a tensile stress that has been applied to the material till the sample breaks. 1- label the axis and draw the curve for a brittle material. 2- indicate the maximum strength of the material. 3- show on the portion of the curve where young's modulus can be calculated.arrow_forward
arrow_back_ios
SEE MORE QUESTIONS
arrow_forward_ios
Recommended textbooks for you
- Elements Of ElectromagneticsMechanical EngineeringISBN:9780190698614Author:Sadiku, Matthew N. O.Publisher:Oxford University Press
 Mechanics of Materials (10th Edition)Mechanical EngineeringISBN:9780134319650Author:Russell C. HibbelerPublisher:PEARSON
 Thermodynamics: An Engineering ApproachMechanical EngineeringISBN:9781259822674Author:Yunus A. Cengel Dr., Michael A. BolesPublisher:McGraw-Hill Education
  Control Systems EngineeringMechanical EngineeringISBN:9781118170519Author:Norman S. NisePublisher:WILEY
 Mechanics of Materials (MindTap Course List)Mechanical EngineeringISBN:9781337093347Author:Barry J. Goodno, James M. GerePublisher:Cengage Learning
 Engineering Mechanics: StaticsMechanical EngineeringISBN:9781118807330Author:James L. Meriam, L. G. Kraige, J. N. BoltonPublisher:WILEY
Elements Of Electromagnetics
Mechanical Engineering
ISBN:9780190698614
Author:Sadiku, Matthew N. O.
Publisher:Oxford University Press
Mechanics of Materials (10th Edition)
Mechanical Engineering
ISBN:9780134319650
Author:Russell C. Hibbeler
Publisher:PEARSON
Thermodynamics: An Engineering Approach
Mechanical Engineering
ISBN:9781259822674
Author:Yunus A. Cengel Dr., Michael A. Boles
Publisher:McGraw-Hill Education
Control Systems Engineering
Mechanical Engineering
ISBN:9781118170519
Author:Norman S. Nise
Publisher:WILEY
Mechanics of Materials (MindTap Course List)
Mechanical Engineering
ISBN:9781337093347
Author:Barry J. Goodno, James M. Gere
Publisher:Cengage Learning
Engineering Mechanics: Statics
Mechanical Engineering
ISBN:9781118807330
Author:James L. Meriam, L. G. Kraige, J. N. Bolton
Publisher:WILEY