
MATLAB: An Introduction with Applications
6th Edition
ISBN: 9781119256830
Author: Amos Gilat
Publisher: John Wiley & Sons Inc
expand_more
expand_more
format_list_bulleted
Related questions
Question
thumb_up100%
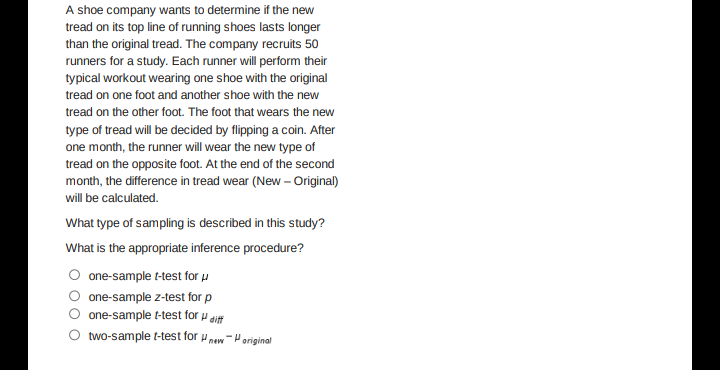

Transcribed Image Text:A shoe company wants to determine if the new
tread on its top line of running shoes lasts longer
than the original tread. The company recruits 50
runners for a study. Each runner will perform their
typical workout wearing one shoe with the original
tread on one foot and another shoe with the new
tread on the other foot. The foot that wears the new
type of tread will be decided by flipping a coin. After
one month, the runner will wear the new type of
tread on the opposite foot. At the end of the second
month, the difference in tread wear (New - Original)
will be calculated.
What type of sampling is described in this study?
What is the appropriate inference procedure?
one-sample t-test for μ
one-sample z-test for p
one-sample t-test for diff
two-sample t-test for new original
Expert Solution
This question has been solved!
Explore an expertly crafted, step-by-step solution for a thorough understanding of key concepts.

Step by stepSolved in 2 steps

Knowledge Booster

Similar questions
- Thirty identical cars are selected for a fuel test. Half of the cars are filled with regular gasoline, and the other half are filled with a new experimental fuel. The cars in the first group average 26.9 miles per gallon, while the cars in the second group average 34.4 miles per gallon. Discuss whether this difference seems statistically significant. For this sample size a _____ % sample size (is, is not) statistically significant.... Round to the nearest whole number as neededarrow_forwardrandom sample of residents from various income brackets were asked their operating on tac reform for the country of Guyana. The data so gathered were analyzed by a statistician and the results he obtained using MINITAB are shown below: Low. Middle. Might. Total For. 26 75 14 115 (30.67) (51.11) (33.22) Against. 60 95 105 260 (69.33) (115.56) (**) Neutral. 34 30 11 75 (20) (33.33) (21.67) Total. * 200 130 450 Child's = 0.71+ 11.17+ 11.12+ ***+ 3.66+ 11.89+ 9.8 0.33+ 5.25=55.2 DF =??, PM value = ??? Carefully define the…arrow_forwardSample median options Box 1= 1,2,1.5 Box 2= 2,2.5,4 Box 3=4.5,6,3 Box 4=4.5,7,9 Box 5= 11,5.5,8.5 Box 6= 12,8,16arrow_forward
- Which kind of sampling plan was used in each of the following situation? Would the plan result in an unbiased sample? - three users of the panther, a new car, reported problems with the trunk lid popping up while driving. The car manufacturer test drove the next 30 cars leaving the factory and found that the trunk lid did not pop open. The manufacturer decided that the problem did not need to be addressed any furtherarrow_forwardWhat is the main advantage of simple random sampling (SRS) over cluster sampling a. SRS is unusually less expensive. b. There is less bias in SRS. c. Cluster sampling involves dividing participants into two groups to study them. d. There is no advantage of SRS over cluster sampling.arrow_forwardWhat is the paired-samples t test statistic for the following difference scores: 2, 6.5, 3, 7.8, 10, 4.2? O 7.10 O 5.58 O 1.25 O 4.46arrow_forward
- In independent sample tests, what is the best way to ensure equivalence between samples? Different levels of the independent variable Convenience Random assignmentarrow_forwardA researcher is trying to determine if nurses who complete a 12-week social activity program have increased levels of job satisfaction at the end of the program compared to when they started it. Which procedure should he use? O Independent samples t-test Repeated measures t-test ANOVA Matched samples t-test étv A O W MacBook Proarrow_forwardA college wants to know how many students work while attending school. It surveys students who eat at the on-campus cafeteria. Students who never eat on campus or only attend classes online never got the survey. Did sampling bias occur? If so, which kind? Yes, there was area bias. Yes, there was social desirability bias. Yes, there was self-selection bias. No sampling bias occurred.arrow_forward
- Classic Golf Incorporated, manages five courses in the Jacksonville, Florida, area. The director of golf wishes to study the number of rounds of golf played per weekday at the five courses. He gathered the following sample Information. Day Rounds Monday 145 Tuesday 110 Wednesday 130 Thursday 115 125 Friday At the 0.05 significance level, is there a difference in the number of rounds played by day of the week? HÅ: Rounds played is the same for each day. H₁: Rounds played is not the same. a. State the decision rule, using the 0.05 significance level. (Round your answer to 3 decimal places.) Reject Ho if chi-square > b. Compute the value of chi-square. (Round your answer to 3 decimal places.) Chi-square valuearrow_forwardA Sales analyst wants to determine whether there is a umerence in the mean mommy sales of a company's four sales regions. Several salespersons from each region are randomly selected and they provide their sales amount (in thousands of dollars) for the previous month. Using a 1% significance, can we conclude at least one region is different on average? Region Sales North North North North East East East East East South South South South West West West West West 34 25 23 34 13 EEEEEEEEE 25 25 32 34 35 13 32 17 33 22 NIS 20 26 14 What is the factor variable? Region What is the response variable? Sales Amount Test Statistic: OF P-Value: Decision Rule: Fail to Reject the Null Did Something Significant Happen? Nothing Significant Happened There is not O to conclude At least one true average sales amount is different between regions. ✓arrow_forwardK Since an instant replay system for tennis was introduced at a major tournament, men challenged 1386 referee calls, with the result that 414 of the calls were overturned. Women challenged 775 referee calls, and 227 of the calls were overturned. Use a 0.05 significance level to test the claim that men and women have equal success in challenging calls. Complete parts (a) through (c) below. Statcrunch W S Consider the first sample to be the sample of male tennis players who challenged referee calls and the second sample to be the sample of female tennis players who challenged referee calls. What are the null and alternative hypotheses for the hypothesis test? OA. Ho: P₁ P2 H₁: P₁ P2 command OD. Ho: P1 P2 H₁: P₁ P2 OL H Identify the test statistic. 2=0 (Round to two decimal places as needed.) Identify the P-value. Tech help V P-value= Round to three darimal places as needed # E D с $ R F % 5 V ALA T G OB. Ho: P1 H₁: P₁ O E. Ho: P₁ H₁: P₁ B MacBook Air Y P2 P2 H P2 P2 J *** N * 00 8 M ; K…arrow_forward
arrow_back_ios
SEE MORE QUESTIONS
arrow_forward_ios
Recommended textbooks for you
- MATLAB: An Introduction with ApplicationsStatisticsISBN:9781119256830Author:Amos GilatPublisher:John Wiley & Sons Inc
 Probability and Statistics for Engineering and th...StatisticsISBN:9781305251809Author:Jay L. DevorePublisher:Cengage Learning
 Statistics for The Behavioral Sciences (MindTap C...StatisticsISBN:9781305504912Author:Frederick J Gravetter, Larry B. WallnauPublisher:Cengage Learning
  Elementary Statistics: Picturing the World (7th E...StatisticsISBN:9780134683416Author:Ron Larson, Betsy FarberPublisher:PEARSON
 The Basic Practice of StatisticsStatisticsISBN:9781319042578Author:David S. Moore, William I. Notz, Michael A. FlignerPublisher:W. H. Freeman
 Introduction to the Practice of StatisticsStatisticsISBN:9781319013387Author:David S. Moore, George P. McCabe, Bruce A. CraigPublisher:W. H. Freeman
MATLAB: An Introduction with Applications
Statistics
ISBN:9781119256830
Author:Amos Gilat
Publisher:John Wiley & Sons Inc
Probability and Statistics for Engineering and th...
Statistics
ISBN:9781305251809
Author:Jay L. Devore
Publisher:Cengage Learning
Statistics for The Behavioral Sciences (MindTap C...
Statistics
ISBN:9781305504912
Author:Frederick J Gravetter, Larry B. Wallnau
Publisher:Cengage Learning
Elementary Statistics: Picturing the World (7th E...
Statistics
ISBN:9780134683416
Author:Ron Larson, Betsy Farber
Publisher:PEARSON
The Basic Practice of Statistics
Statistics
ISBN:9781319042578
Author:David S. Moore, William I. Notz, Michael A. Fligner
Publisher:W. H. Freeman
Introduction to the Practice of Statistics
Statistics
ISBN:9781319013387
Author:David S. Moore, George P. McCabe, Bruce A. Craig
Publisher:W. H. Freeman