MATLAB: An Introduction with Applications
6th Edition
ISBN: 9781119256830
Author: Amos Gilat
Publisher: John Wiley & Sons Inc
expand_more
expand_more
format_list_bulleted
Question
thumb_up100%

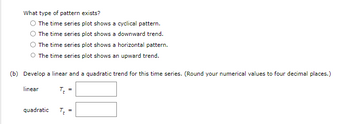
Transcribed Image Text:What type of pattern exists?
The time series plot shows a cyclical pattern.
The time series plot shows a downward trend.
The time series plot shows a horizontal pattern.
O The time series plot shows an upward trend.
(b) Develop a linear and a quadratic trend for this time series. (Round your numerical values to four decimal places.)
linear
TE
quadratic
TE
=
=

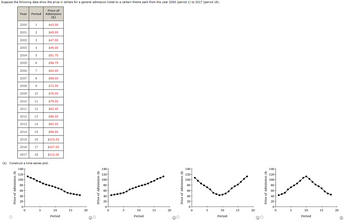
Transcribed Image Text:Suppose the following data show the price in dollars for a general admission ticket to a certain theme park from the year 2000 (period 1) to 2017 (period 18).
Price of
Admission
($)
Year Period
Price of Admission ($)
2000
2001
2002
2003
2004
2005
2006
2007
2008
2009
2010
2011
2012
2013
2014
2015
2016
2017
80
60
40
20
0-
1
0
2
3
4
5
6
7
8
9
10
11
12
13
14
15
16
17
18
$43.00
5
$45.00
$47.00
$49.00
$51.75
$56.75
$64.00
$68.00
$72.00
$76.00
$79.00
$82.00
$86.00
$92.00
(a) Construct a time-series plot.
140
120
100-
$96.00
$103.00
$107.00
$112.00
10
Period
15
20
Price of Admission ($)
140 T
120-
100
80
60
40+
20
0
0
5
10
Period
15
20
Price of Admission ($)
140-
120-
100-
80
60+
40
20
0
0
5
10
Period
15
20
Ⓡ
Price of Admission ($)
140-
120+
100-
80
60+
40-
20
0
0
5
10
Period
15
20
Ⓡ
Expert Solution
This question has been solved!
Explore an expertly crafted, step-by-step solution for a thorough understanding of key concepts.
Step by stepSolved in 3 steps with 3 images

Knowledge Booster
Similar questions
- Price of Gold. The price of gold (end-of-year closing price in dollars per troy ounce) is shown in the table below. Year 1986 1996 2006 2016 Price $391 $369 $636 $1152 The prices shown in the table are not adjusted for inflation. Revise the above table to express all prices in terms of 2016 dollars. If you bought 3 ounces of gold in 1986 and sold it in 1996, would you have seen a profit (adjusted for inflation)? Explain. If you bought 3 ounces of gold in 2006 and sold it in 2016, would you have seen a profit (adjusted for inflation)? Explain.arrow_forwardA Falling Ball In a physics experiment a lead ball is dropped from a height of 5 m. The students record the distance the ball has fallen every one-tenth of a second. (This can be done by using a camera and a strobe light.) Their data are shown in the margin. (a) Make a scatter plot of the data. (b) Use a calculator to find a power model. (c) Use your model to predict how far a dropped ball would fall in 3 s. Time Distance (s) (m) 0.1 0.048 0.2 0.197 0.3 0.441 0.4 0.882 0.5 1.227 0.6 1.765 2.401 3.136 0.7 0.8 0.9 3.969 1.0 4.902 00 0arrow_forwardQuestion content area Part 1 At low altitudes, the altitude of a skydiver and time in the air are linearly related. A skydiver jumps out of a low-flying plane. If the plane is 2000 feet above the ground and the jump lasts 85 seconds, how high above the ground was the skydiver 50 seconds after he jumped? He would be enter your response here feet above the ground. (Round answer to nearest tenth of a foot.)arrow_forward
- Consider an astronaut on a large planet in another galaxy. To learn more about the composition of this planet, the astronaut drops an electronic sensor into a deep trench. The sensor transmits its vertical position every second in relation to the astronaut's position. The summary of the falling sensor data is displayed in the following table. Time after Position (m) dropping (s) 1. -1 -2 3 -4 4 -8 5 -14 (a) Using a calculator or computer program, find the best-fit quadratic curve to measure the position of the sensor (in m) as a function of t, the time (in s) after the sensor is dropped. (Round all numerical values to four decimal places.) P(t) = (b) Find the derivative of the position function from part (a). p'(t) = tive. wncor yıve (c) Find the second derivative of the position function from part (a). p "(t) = LApiam py The ---nd dorivative f the nocition functio-arrow_forwardDaily High Temperature Application The table below shows the daily high temperatures in northern Washington during one week in January in the early 2000's. What was the average daily high temperature for that week? Round your answer to one decimal place. Day Temperature Mon. Tue Wed. Thu. Fri Sat Sun -4° -7° -2° The average temperature for the week was Fahrenheit. 0° 2° -5° -8° degreesarrow_forwardb and c partarrow_forward
- When we chart the price of milk in 1995 dollars we find that it has become slightly more expensive ,but when we chart it in 1975 dollars we find that it has become cheaper. Which statement is correct ?? a. Not make sense, because prices always rise with time b. Not make sense, because the same trend would be seen regardless of what kind of dollars are used c.make sense, because 1975 dollars are worth than 1995 dollars d.make sense,because 1995 dollars more worth than 1975 dollarsarrow_forwardListed below are speeds (mi/h) measured from traffic on a busy highway. This simple random sample was obtained at 3:30 P.M. on a weekday. Use the sample data to construct a 90% confidence interval estimate of the population standard deviation. 60 65 65 57 65 53 59 58 59 68 58 66 D Click the icon to view the table of Chi-Square critical values. -.... The confidence interval estimate is mi/harrow_forwardExtra Problem A student is speeding down Highway 16 in her fancy red Porsche when her radar system warns her of an obstacle 400 feet ahead. She immediately applies the brakes, starts to slow down, and spots a skunk in the road directly ahead of her. The "black box" in the Porsche records the car's speed every two seconds, producing the following table. The speed decreases throughout the 10 seconds it takes to stop, although not necessarily at a uniform rate. Time since brakes applied (sec) 0 2 4 6 8 10 Speed (ft/sec) 105 85 55 20 15 0 A. What is your best estimate of the total distance the student's car traveled before coming to rest (note that the best estimate is probably not the over or under estimate that you can most easily find, use the trapezoidal approximation)? distance = B. Given the fact that the Porsche slows down during breaking, give a sharp i. underestimate of the distance traveled: ii. overestimate of the distance traveled: C. Which one of the following statements can…arrow_forward
- Betty and Bob invest $2,000 in an account. a. After 8 years the account balance is $6,129.71. Find their per annum continuous rate of return. Your final answer should be correct to 2 places after the decimal point. ______________ b. If the trend continuous then find the account balance after 20 years. Your final answer should be correct to 2 places after the decimal point. _____________arrow_forwardSubject : Statesticarrow_forwardFind text or tools Use the information provided below to answer questions 24-25. INFORMATION The times series graph below shows information about the quarterly number of tourists from the European Union (EU) to vh Africa over the 2021-2023 period. The underlying trend line indicated by the dotted line is defined by the equation, y 703x-176 577. Time ones graph of quarterly number of tourists for EU to South 40000 REANDDIC 300000 2240 2010 200000 150000 18390 1000 0 2 --T Arica (2021-2023) 12920 30000 2013 8 10 1999 18 QUESTION 24 (4 marks) Using data from the graph, estimate the mean seasonal variation (or average seasonal effect) for quarter 4 (Q4) and use it to predict the number of tourists from the EU expected to visit South Africa in quarter 4 of 2024. A. The mean seasonal variation is -25 000; the number of tourists from the EU expected to visit South Africa in quarter 4 of 2024 is 322 825. B. The mean seasonal variation is 25 000, the number of tourists from the EU expected to…arrow_forward
arrow_back_ios
arrow_forward_ios
Recommended textbooks for you
 MATLAB: An Introduction with ApplicationsStatisticsISBN:9781119256830Author:Amos GilatPublisher:John Wiley & Sons Inc
 Probability and Statistics for Engineering and th...StatisticsISBN:9781305251809Author:Jay L. DevorePublisher:Cengage Learning
 Statistics for The Behavioral Sciences (MindTap C...StatisticsISBN:9781305504912Author:Frederick J Gravetter, Larry B. WallnauPublisher:Cengage Learning
 Elementary Statistics: Picturing the World (7th E...StatisticsISBN:9780134683416Author:Ron Larson, Betsy FarberPublisher:PEARSON
 The Basic Practice of StatisticsStatisticsISBN:9781319042578Author:David S. Moore, William I. Notz, Michael A. FlignerPublisher:W. H. Freeman
 Introduction to the Practice of StatisticsStatisticsISBN:9781319013387Author:David S. Moore, George P. McCabe, Bruce A. CraigPublisher:W. H. Freeman

MATLAB: An Introduction with Applications
Statistics
ISBN:9781119256830
Author:Amos Gilat
Publisher:John Wiley & Sons Inc

Probability and Statistics for Engineering and th...
Statistics
ISBN:9781305251809
Author:Jay L. Devore
Publisher:Cengage Learning

Statistics for The Behavioral Sciences (MindTap C...
Statistics
ISBN:9781305504912
Author:Frederick J Gravetter, Larry B. Wallnau
Publisher:Cengage Learning

Elementary Statistics: Picturing the World (7th E...
Statistics
ISBN:9780134683416
Author:Ron Larson, Betsy Farber
Publisher:PEARSON

The Basic Practice of Statistics
Statistics
ISBN:9781319042578
Author:David S. Moore, William I. Notz, Michael A. Fligner
Publisher:W. H. Freeman

Introduction to the Practice of Statistics
Statistics
ISBN:9781319013387
Author:David S. Moore, George P. McCabe, Bruce A. Craig
Publisher:W. H. Freeman