MATLAB: An Introduction with Applications
6th Edition
ISBN: 9781119256830
Author: Amos Gilat
Publisher: John Wiley & Sons Inc
expand_more
expand_more
format_list_bulleted
Question

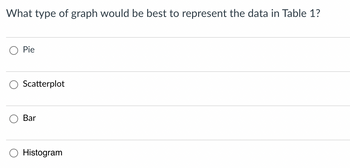
Transcribed Image Text:**Question:**
What type of graph would be best to represent the data in Table 1?
**Answer Choices:**
- Pie
- Scatterplot
- Bar
- Histogram
---
To choose the most appropriate type of graph for representing the data in Table 1, it's essential to understand the nature of the data and the specific relationships you want to highlight. Each type of graph has its advantages:
- **Pie Chart:** Best for showing proportions or percentages of a whole.
- **Scatterplot:** Useful for displaying relationships or correlations between two continuous variables.
- **Bar Chart:** Ideal for comparing discrete categories or groups.
- **Histogram:** Shows frequency distribution of a continuous variable and is used to understand the data's underlying distribution.
Make your selection based on which graph type best represents the data characteristics you're working with.

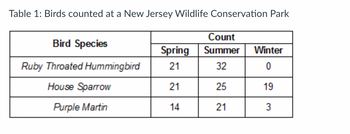
Transcribed Image Text:**Table 1: Birds counted at a New Jersey Wildlife Conservation Park**
This table shows the counts of three bird species observed during different seasons (Spring, Summer, and Winter) at a New Jersey Wildlife Conservation Park.
| Bird Species | Count | | |
|-----------------------------|-------|----------|----------|
| | Spring| Summer | Winter |
| Ruby Throated Hummingbird | 21 | 32 | 0 |
| House Sparrow | 21 | 25 | 19 |
| Purple Martin | 14 | 21 | 3 |
**Explanation of Table:**
- **Header Row:**
- Lists the bird species being observed: Ruby Throated Hummingbird, House Sparrow, and Purple Martin.
- Displays the season categories: Spring, Summer, and Winter.
- **Data Rows:**
- For each bird species, the table provides the count of individuals observed during each season.
- **Ruby Throated Hummingbird:** The counts are 21 in Spring, 32 in Summer, and 0 in Winter.
- **House Sparrow:** The counts are 21 in Spring, 25 in Summer, and 19 in Winter.
- **Purple Martin:** The counts are 14 in Spring, 21 in Summer, and 3 in Winter.
This data helps in understanding the seasonal population variations of different bird species within the wildlife conservation park.
Expert Solution
This question has been solved!
Explore an expertly crafted, step-by-step solution for a thorough understanding of key concepts.
Step by stepSolved in 3 steps

Knowledge Booster
Similar questions
- 3. What type of graph should you create to visualize the following frequency data? Explain. - Counting the brands of cell phones owned by student - The different body weights reported in a statewide survey - The people falling into one of the eigth salary ranges - The number of students who were absent from class each day for the month of October - The number of students falling into A, B, C, D or F grade range - The time it takes a sample of college students to complete some memory task - The direction of a person's eye movement (right, left, or center) when s/he is telling a liearrow_forwardData was collected for a sample of 7 organic snacks. The amount of sugar (in mg) in each snack is summarized in the histogram below. Snack Graph 12+ 10- 24 Snacks What is the sample size for this data set?arrow_forwardHelparrow_forward
- The red blood cell count of a healthy person was measured on each of 15 days. The number recorded is measured in 106 cells per microliter. 5.4 5.2 5.0 5.2 5.55.3 5.4 5.2 5.1 5.35.3 4.9 5.4 5.2 5.2 A. Choose from the choices the most applicable graph to describe the data. - dotplot, histogram, stem leaf plot, or line graph? Why? B. Describe the shape of the data distribution. Explain your answer. C. Describe the location of the red blood cell counts. Explain your answer.arrow_forwardTask-4. What is normal, positively, and negatively skewed frequency distribution? Accordingly, what shapes of such frequency distributions can a histogram adopt, draw, and label them?arrow_forwardThank you. Can you please provide the Boxplot graphs for both sets of data and compare the graphs as well?arrow_forward
arrow_back_ios
arrow_forward_ios
Recommended textbooks for you
 MATLAB: An Introduction with ApplicationsStatisticsISBN:9781119256830Author:Amos GilatPublisher:John Wiley & Sons Inc
 Probability and Statistics for Engineering and th...StatisticsISBN:9781305251809Author:Jay L. DevorePublisher:Cengage Learning
 Statistics for The Behavioral Sciences (MindTap C...StatisticsISBN:9781305504912Author:Frederick J Gravetter, Larry B. WallnauPublisher:Cengage Learning
 Elementary Statistics: Picturing the World (7th E...StatisticsISBN:9780134683416Author:Ron Larson, Betsy FarberPublisher:PEARSON
 The Basic Practice of StatisticsStatisticsISBN:9781319042578Author:David S. Moore, William I. Notz, Michael A. FlignerPublisher:W. H. Freeman
 Introduction to the Practice of StatisticsStatisticsISBN:9781319013387Author:David S. Moore, George P. McCabe, Bruce A. CraigPublisher:W. H. Freeman

MATLAB: An Introduction with Applications
Statistics
ISBN:9781119256830
Author:Amos Gilat
Publisher:John Wiley & Sons Inc

Probability and Statistics for Engineering and th...
Statistics
ISBN:9781305251809
Author:Jay L. Devore
Publisher:Cengage Learning

Statistics for The Behavioral Sciences (MindTap C...
Statistics
ISBN:9781305504912
Author:Frederick J Gravetter, Larry B. Wallnau
Publisher:Cengage Learning

Elementary Statistics: Picturing the World (7th E...
Statistics
ISBN:9780134683416
Author:Ron Larson, Betsy Farber
Publisher:PEARSON

The Basic Practice of Statistics
Statistics
ISBN:9781319042578
Author:David S. Moore, William I. Notz, Michael A. Fligner
Publisher:W. H. Freeman

Introduction to the Practice of Statistics
Statistics
ISBN:9781319013387
Author:David S. Moore, George P. McCabe, Bruce A. Craig
Publisher:W. H. Freeman